
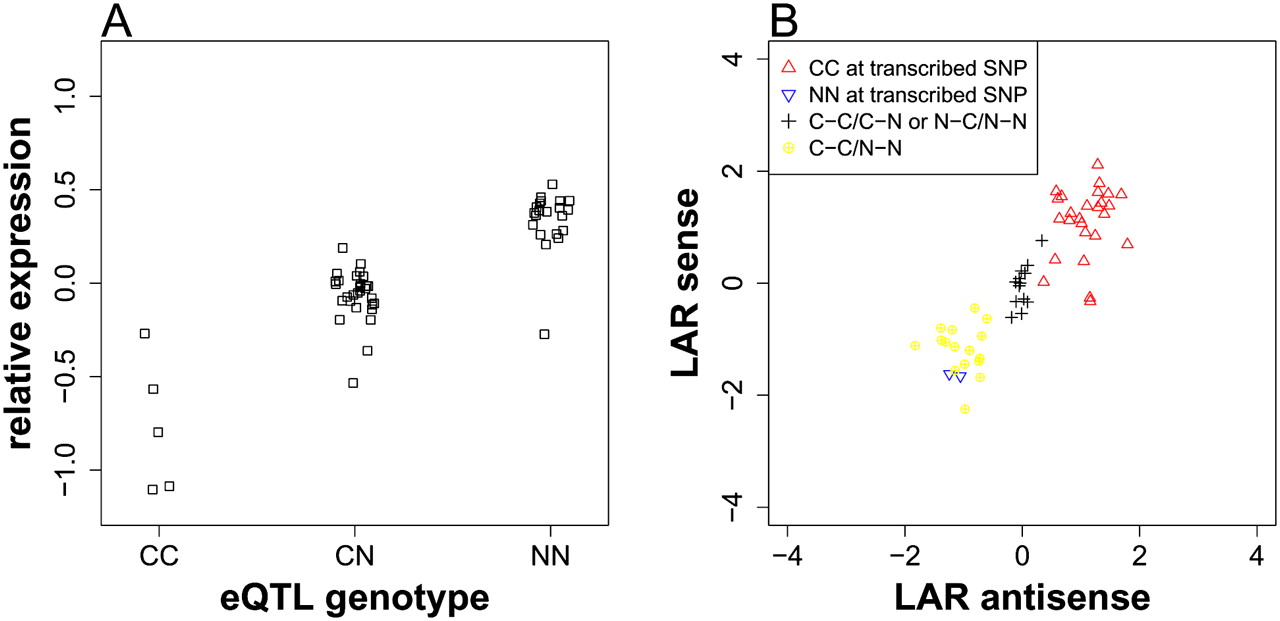
An example of cis-acting, locally associated SNP. (A) The relative gene expression levels were plotted against the genotypes at the associated SNP, located at 3,041,799 bp on chromosome 1. (C) Col allele; (N) non-Col allele. (B) The log allele ratios (LARs) of the sense strain were plotted against LARs of antisense strain for the transcribed SNP, located at 3,041,022 bp on chromosome 1. An explanation of legends follows: (CC at transcribed SNP) lines for which transcribed SNP is homozygous Col allele; (NN at transcribed SNP) lines for which transcribed SNP is homozygous non-Col allele; (C-C/C-N or N-C/N-N) lines for which transcribed SNP is heterozygous but the regulatory SNP is homozygous; (C-C/N-N) lines for which transcribed SNP is heterozygous and the regulatory SNP is in phase with transcribed SNP. In this case, the non-Col allele at the regulatory SNP up-regulates gene expression.


