
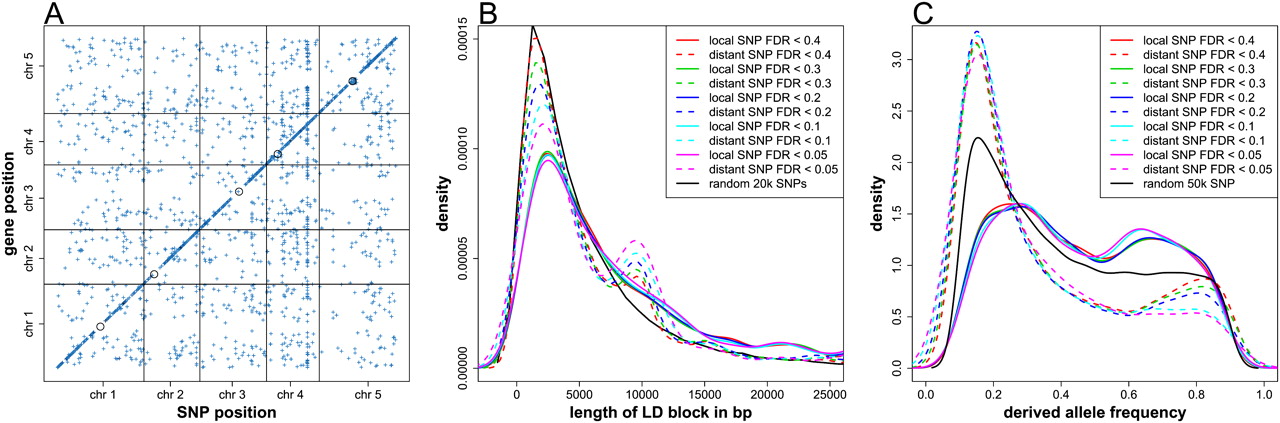
GWA for gene expression. (A) The middle position of the mapped genes was plotted against the chromosome position of the associated SNPs detected at FDR < 0.2. The intensity of the points indicates the effect (r2) of the corresponding association. (Black circles) Centromeres. (B) The length distribution of LD blocks surrounding locally (solid lines) and distantly (dashed lines) associated SNPs, detected at different FDR thresholds. LD block length was defined as the distance between the first two flanking SNPs, with which focal SNP r2 < 0.1. (Black line) Randomly sampled 20,000 SNPs without local or distant association. The small peak between 8 and 12 kb for the distant associations included 470 associations, 126 of which were with the largest trans hot spot located at 14,423,393 bp on chromosome 4. (C) The frequency distribution of the derived alleles of locally (solid line) and distantly (dashed line) associated SNPs, detected at different FDR thresholds. (Black line) Randomly sampled 50,000 SNPs without local or distant association.


