
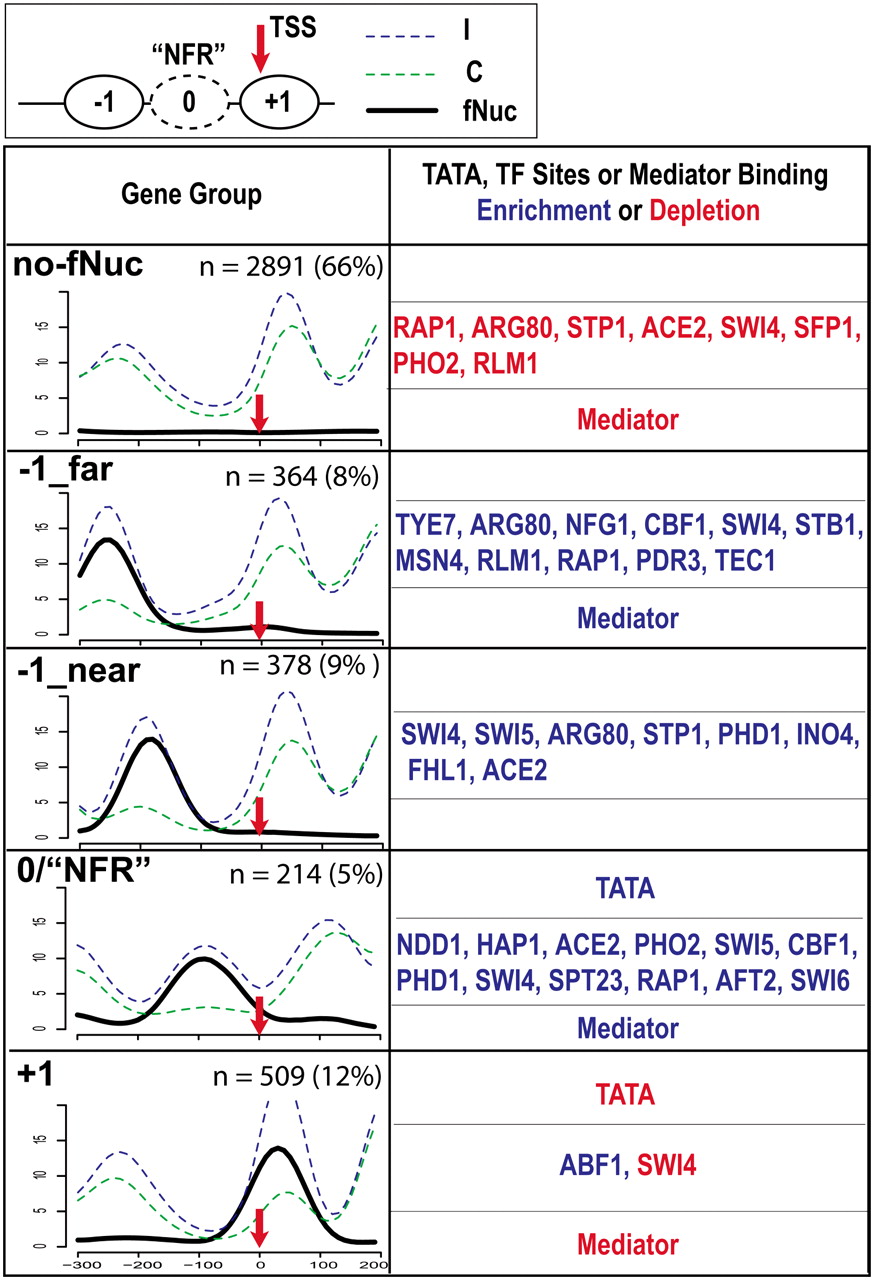
Classification of RNAP II genes into five groups by K-means clustering based on fragile nucleosome occupancy in promoters. (Upper) A diagram illustrating the canonical nucleosomal organization at the promoter. TSS (red arrow): transcription start site; ovals labeled with +1 and −1 are nucleosomes on or upstream to TSS. Oval in dashed line (0) is the fragile nucleosome at the NFR. The “Gene Group” column depicts the overlay of nucleosome distribution of all the genes in each group. Group names, based on the fragile nucleosome position, are in bold at upper left corners. (x-axis) The nucleotide positions, with TSS = 0. (y-axis) The normalized number of sequencing counts. (Blue) Incomplete digestion; (green) complete digestion; (black) differential signals representing fragile nucleosome; (n) numbers of genes in each group; the percentage indicates the portion of total characterized genes. Enrichment and depletion of TATA, TF sites, and mediator binding are marked by blue and red, respectively. The P-value cutoff for TF binding site enrichment is 1.0 × 10⁻¹⁰.


