
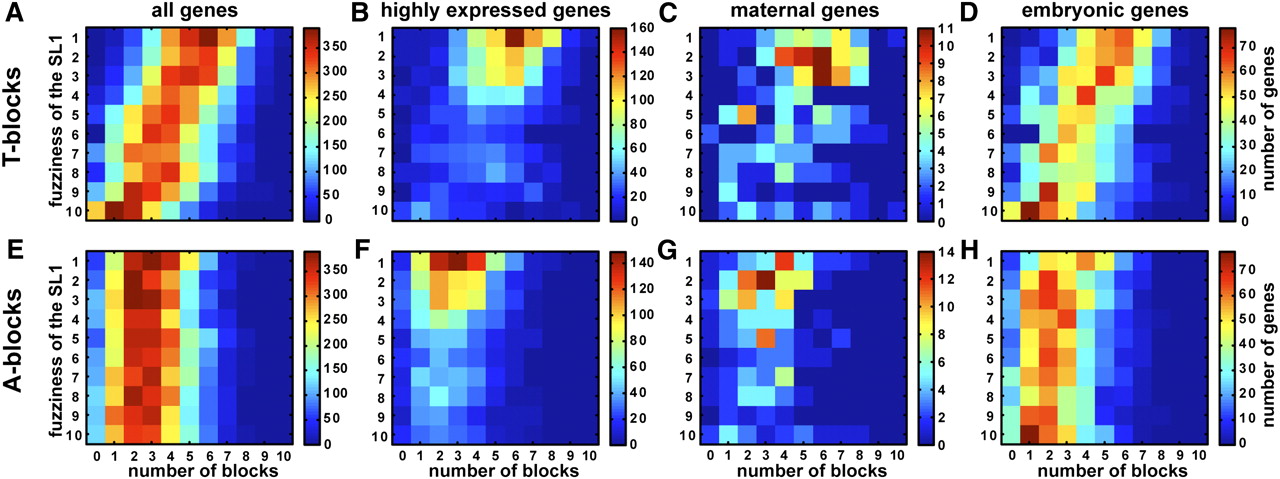
Highly expressed genes have both a preponderance of T-blocks and a precise SL1 motif. In each heat map, genes are mapped onto a plane of the number of T-blocks (and A-blocks) and the fuzziness of the SL1 motif. SL1 fuzziness is determined by dividing the set into 10 equally populated groups according to the P-value of the best match of the SL1 motif to the gene's core promoter (see Methods). The heat maps correspond to the number of T-blocks (top) and A-blocks (bottom) for all genes (A,E), highly expressed genes (B,F), maternally expressed genes (C,G), and embryonically expressed genes (D,H). The latter three groups are mutually exclusive by definition (see Methods).


