
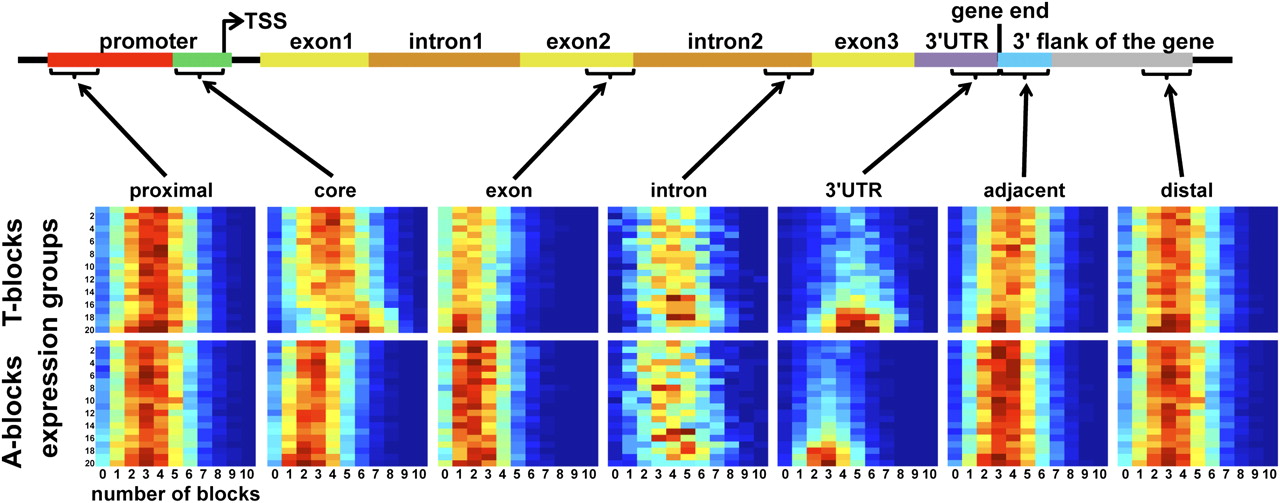
Figure 5.
The correlation between T-block occurrences and expression level is unique to the core promoter. For each of seven gene regions, including the proximal promoter, end of second exon and intron, 3′ UTR, and the 3′ adjacent and 3′ distal end regions, the T-block and A-block frequency is shown for different expression groups as in Figure 4. The 3′ UTR and core promoter are T-rich, while exons are A-rich. For each region, 100 bp were selected as the core promoter. Ensembl annotation was used to identify the second exon and intron, ignoring alternatively spliced sequences.


