
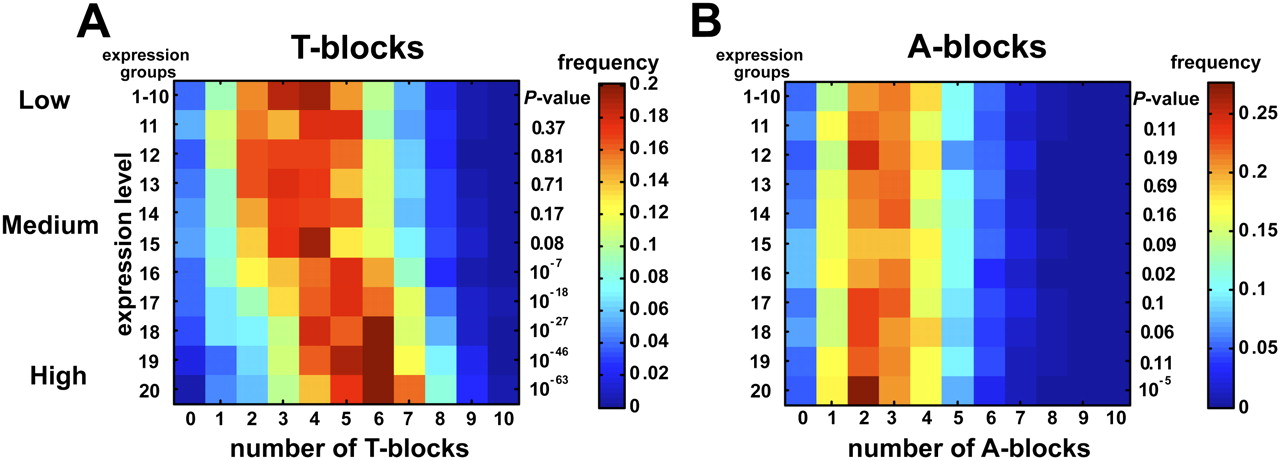
The number of T-blocks, but not the number of A-blocks, correlates with gene expression levels. (A) For each set of genes with a given level of expression, the distribution of the number of T-blocks is shown as a heat map. Twenty equally populated groups of genes were defined based upon their gene expression levels. Most genes have a low level of expression, and thus the ten groups with the lowest expression levels were merged into one, “1” group. The remaining ten are shown in the figures as groups 11 through 20. The distribution of T-blocks of each category was compared with that of the “1” group and the P-value (Kolmogrov-Smirnov test) is indicated to the right. (B) Same as (A) for A-blocks.


