
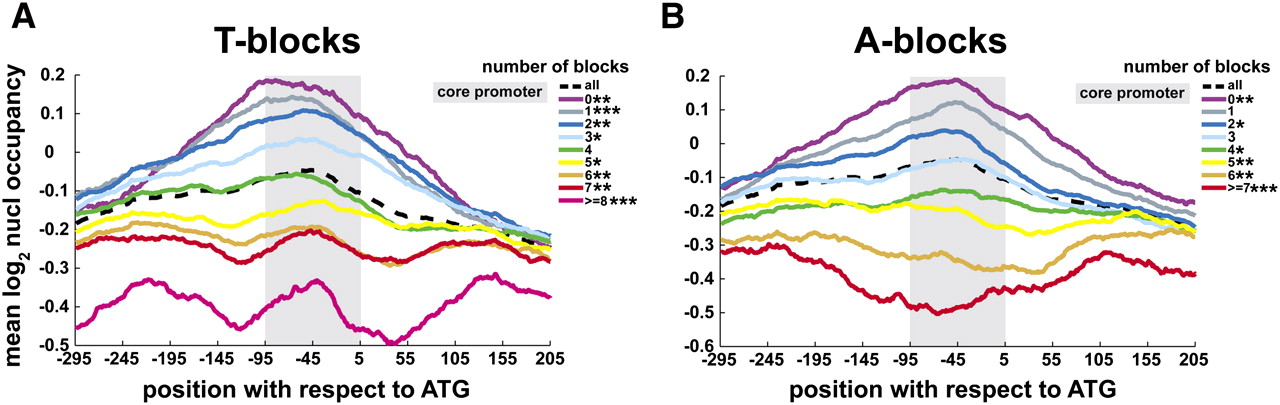
Figure 3.
The number of T-blocks and A-blocks correlates with nucleosome eviction. (A) For each set of genes with a given number of T-blocks, the mean log2 nucleosome occupancy is shown for each base pair in the −296 to +205 region with respect to the ATG. The mean nucleosome occupancy for all genes in this region is indicated by the dashed line. Significance of differences between the distribution of particular T-block counts and the genome average are indicated as stars in the legend (*, P < 10−5; **, P < 10−10; ***, P < 10−20). (B) The same as A for A-blocks. The normalized nucleosome occupancy data was obtained from Valouev et al. (2008).


