
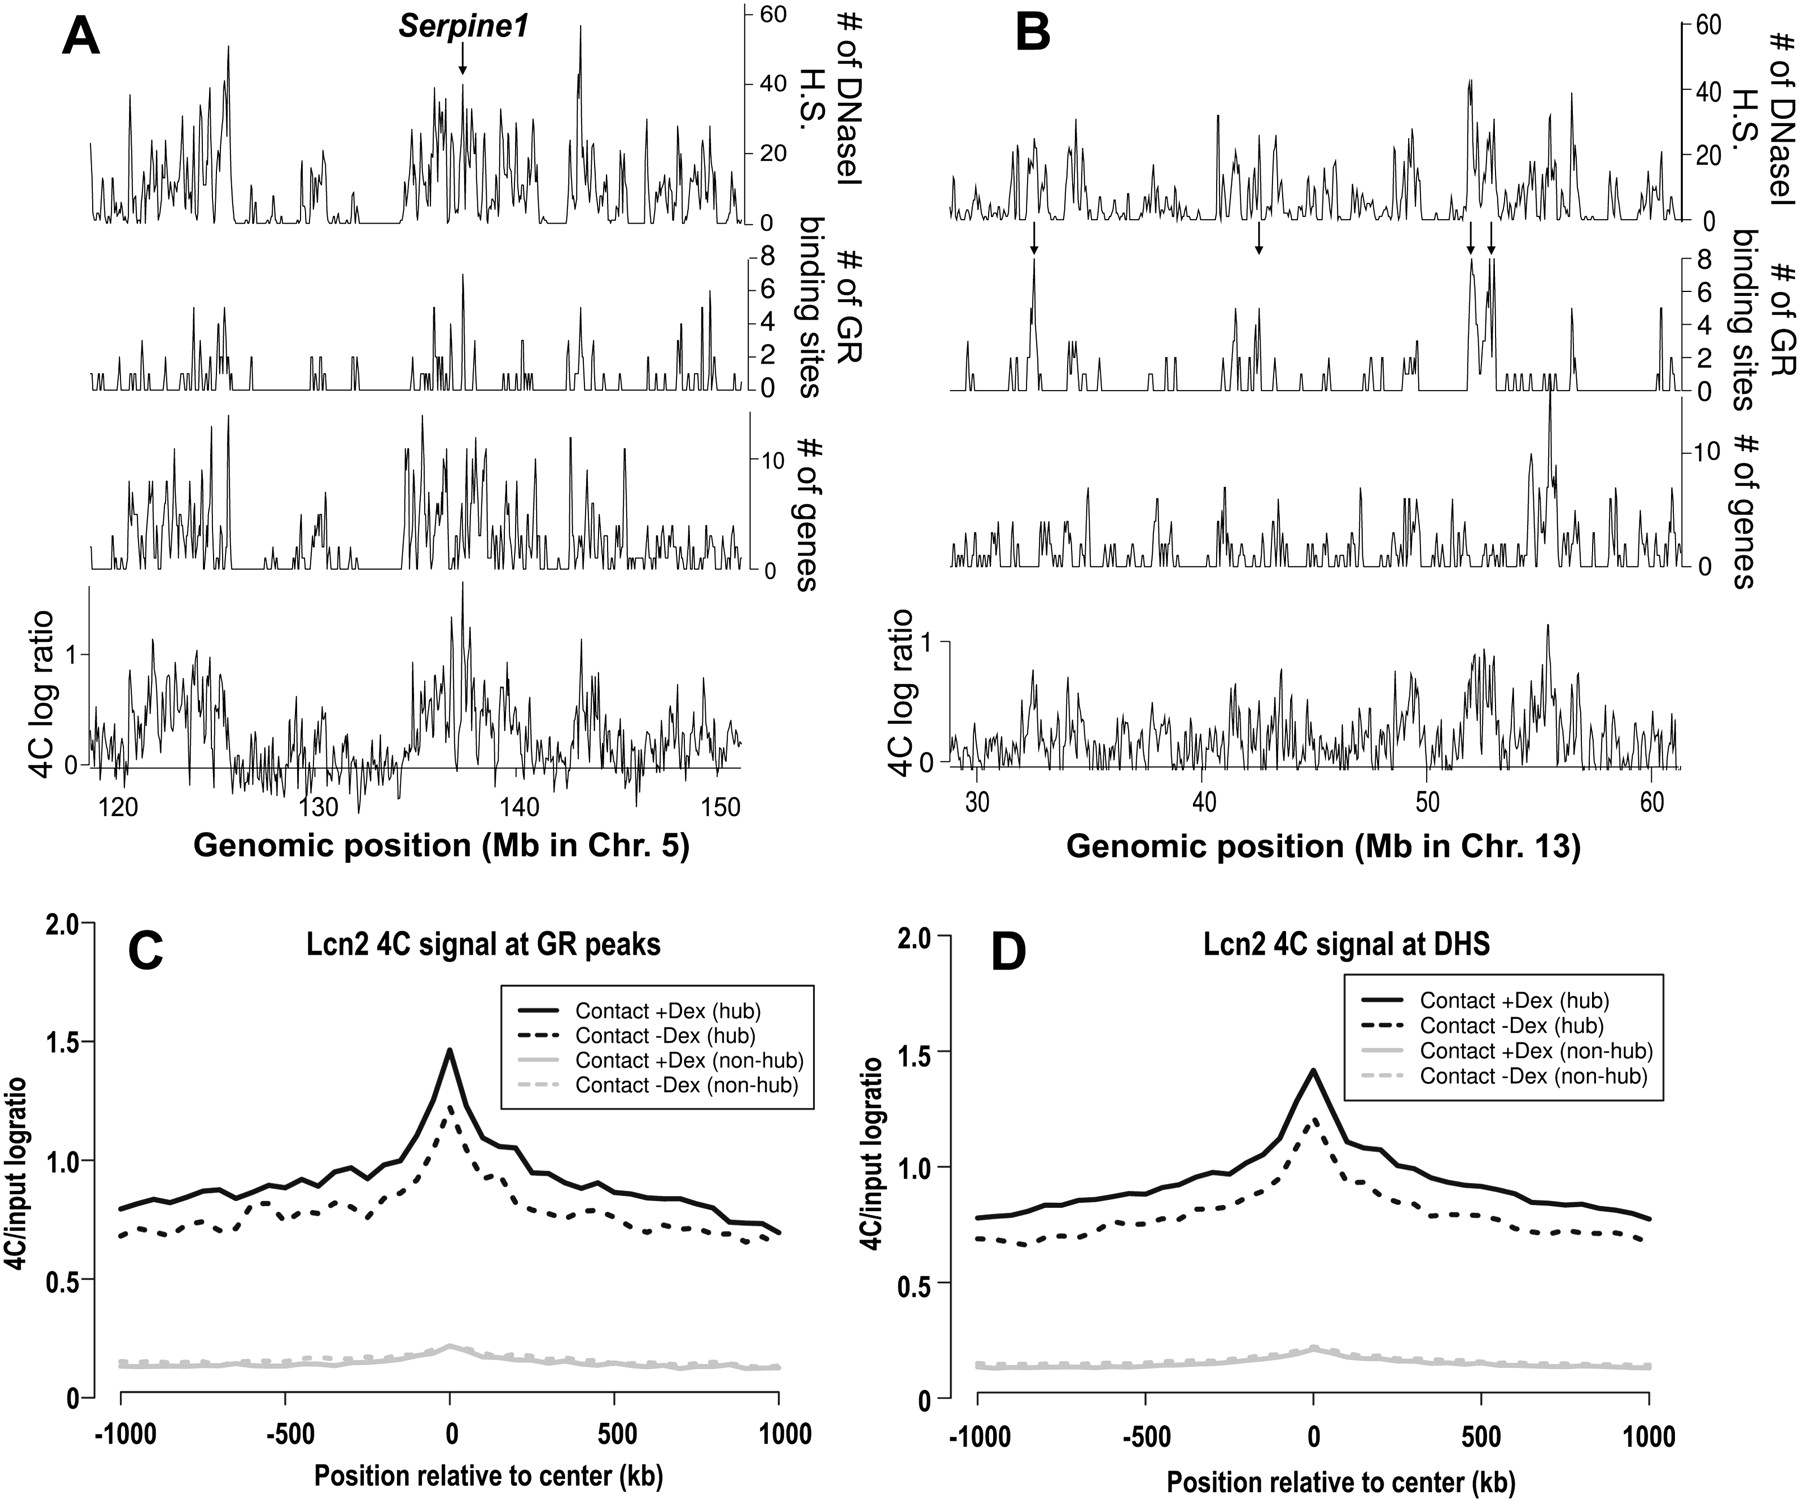
Lcn2 contact regions tend to be gene-dense or in close proximity to numerous GR-binding sites and DHS. (A,B) Profiles of Lcn2 4C signal 1 h after Dex treatment (average log2 ratios/100 kb), gene density (number of TSS/100 kb), GR-binding density (number of binding sites/100 kb), and the density of DHS after Dex (number of DHS/100 kb). (Arrow in A) The location of a GR-regulated gene, Serpine1. (Arrows in B) Point to contact regions in gene-poor regions that have numerous clustered GR-binding and DHS sites, showing that the enrichment of GR-binding and DHS sites can be observed independently of gene density in the contact loci. The genomic position in mm8 coordinates is indicated on the horizontal axis. Additional examples are provided in Supplemental Figure S5. (C,D) Average Lcn2 contact probabilities increase at GR-binding sites and DHS after Dex induction. Mean 4C signal (solid, after Dex; dashed, before Dex) centered at genome-wide GR binding sites (C) or DHS (D). Sites that are within 10 kb of Lcn2 contact loci (pooled from loci before and after Dex) were under the “hub” category (black), and those located at least 200 kb from Lcn2 or Arrdc2 contacts were included in the “non-hub” category (gray).


