
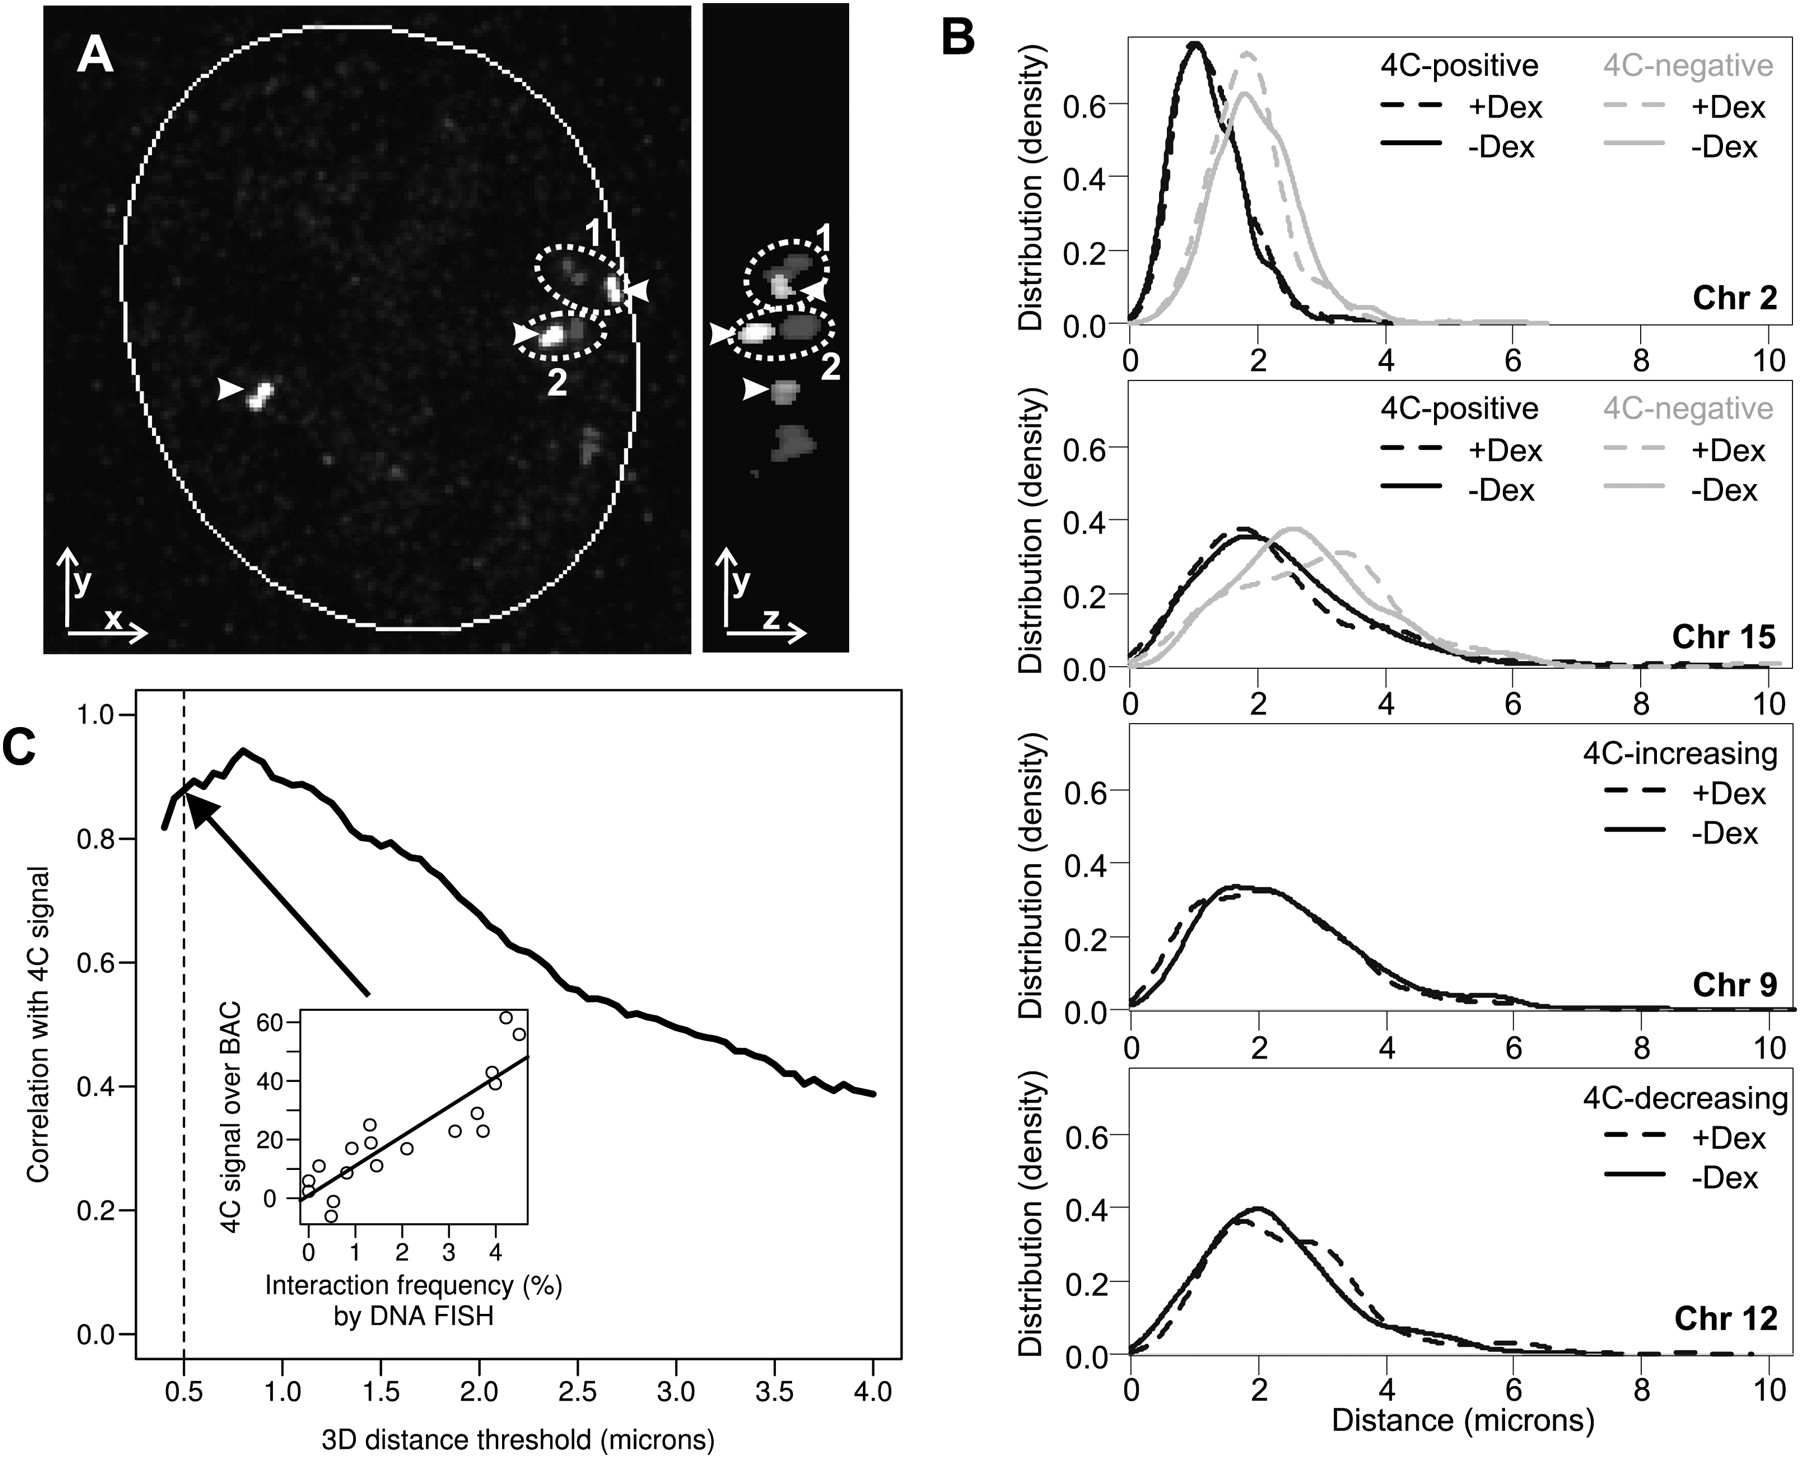
High correlation between 4C and 3D DNA FISH. (A) Automated image analysis computer algorithm for measuring the three-dimensional distance between the centers of two DNA FISH signals. (Left panel) Example of a nucleus from imaging DNA FISH as presented by 2D xy projection. The Lcn2 locus on chromosome 2 (arrowhead) and a locus on chromosome 8 in the nucleus. From this view, pair 2 is the closest one. (Right panel) yz view of the nucleus showing that the upper pair of FISH foci (1) is closer than pair 2 in 3D. (B) Distribution of 3D distances between Lcn2 and other loci as determined by DNA FISH, before (solid line) and after (dashed line) induction by Dex. (Top panel) Distances between Lcn2 (at Chr2: 32 Mb) and a locus scored positive (at Chr2: 164 Mb, black) or a locus called negative (at Chr2: 141 Mb, gray) by 4C for intrachromosomal interaction. (Second from top) Distances between Lcn2 and a locus scored positive (Chr15: 102 Mb, black) or a locus called negative (Chr15: 20 Mb, gray) by 4C for interchromosomal interaction. (Bottom two panels) Distance distributions for loci that had an increase (Chr9: 108 Mb) or a decrease (Chr12: 105 Mb) in 4C signals with respect to Lcn2. To estimate the distribution density, 200–1000 cells were examined by the automated algorithm for each probe and condition (see Supplemental Table S3; BACs [A, C], [H, I], E, and G correspond to the four panels, from top to bottom). (C) Robust correlation between the 4C contact probability and interaction frequency by 3D DNA FISH over different FISH distance thresholds. Interaction frequency (percentage of cells containing Lcn2 contact) was determined by calculating the proportion of nuclei that had the two FISH signals within a set distance threshold (center-to-center in 3D). The distance threshold was varied from 0.4 to 4 μm, and the corresponding correlation coefficient between the integrated 4C signal over BAC and interaction frequency by DNA FISH was calculated for each threshold on all the experiments (see Supplemental Table S3). (Inset) An example correlation for a distance threshold at 0.5 μm.


