
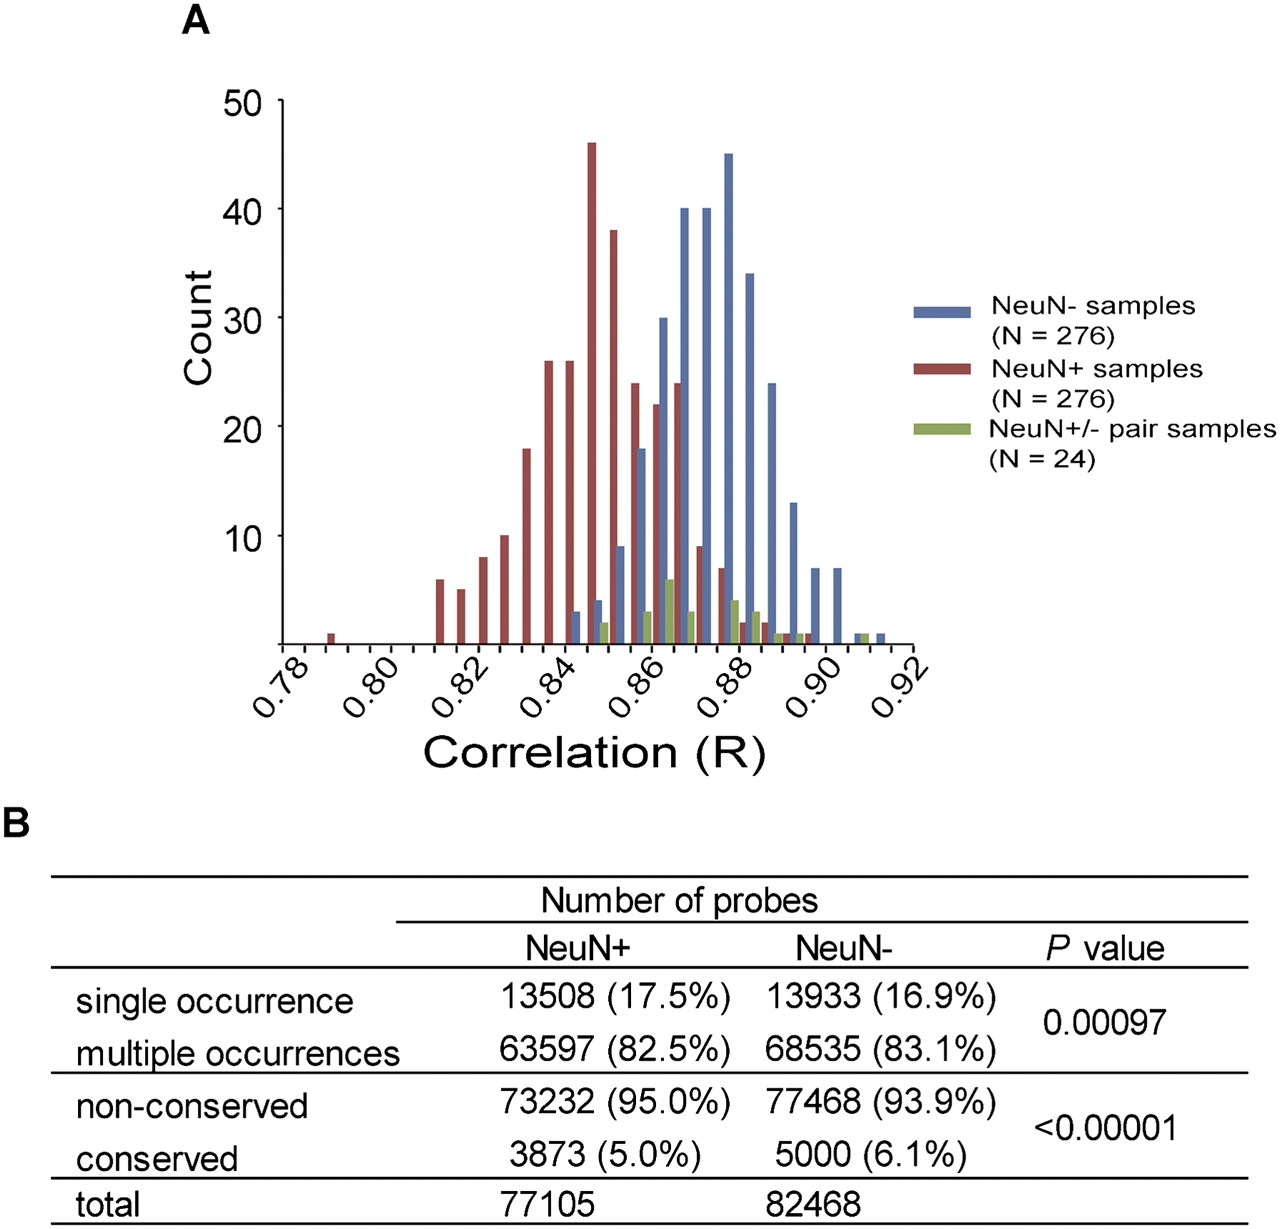
Confirmation of higher variations in neurons compared with non-neurons. (A) Histogram of correlation determined in independent samples (n = 24 male control subjects). Pairwise correlation coefficients were plotted. Red, blue, and green bars indicate comparison between NeuN+ samples, between NeuN− samples, and between NeuN+ and NeuN− from the same subject, respectively. (B) Interindividual variations of the location of neuronal and non-neuronal MRs. Single occurrence: methylated probes found in one subject. Multiple occurrences: methylated probes shared by more than two subjects. Nonconserved: methylated probes in one subject or shared by up to 23 subjects. Conserved: MRs methylated probes shared by all subjects. P-values are determined by the Fisher exact test.


