
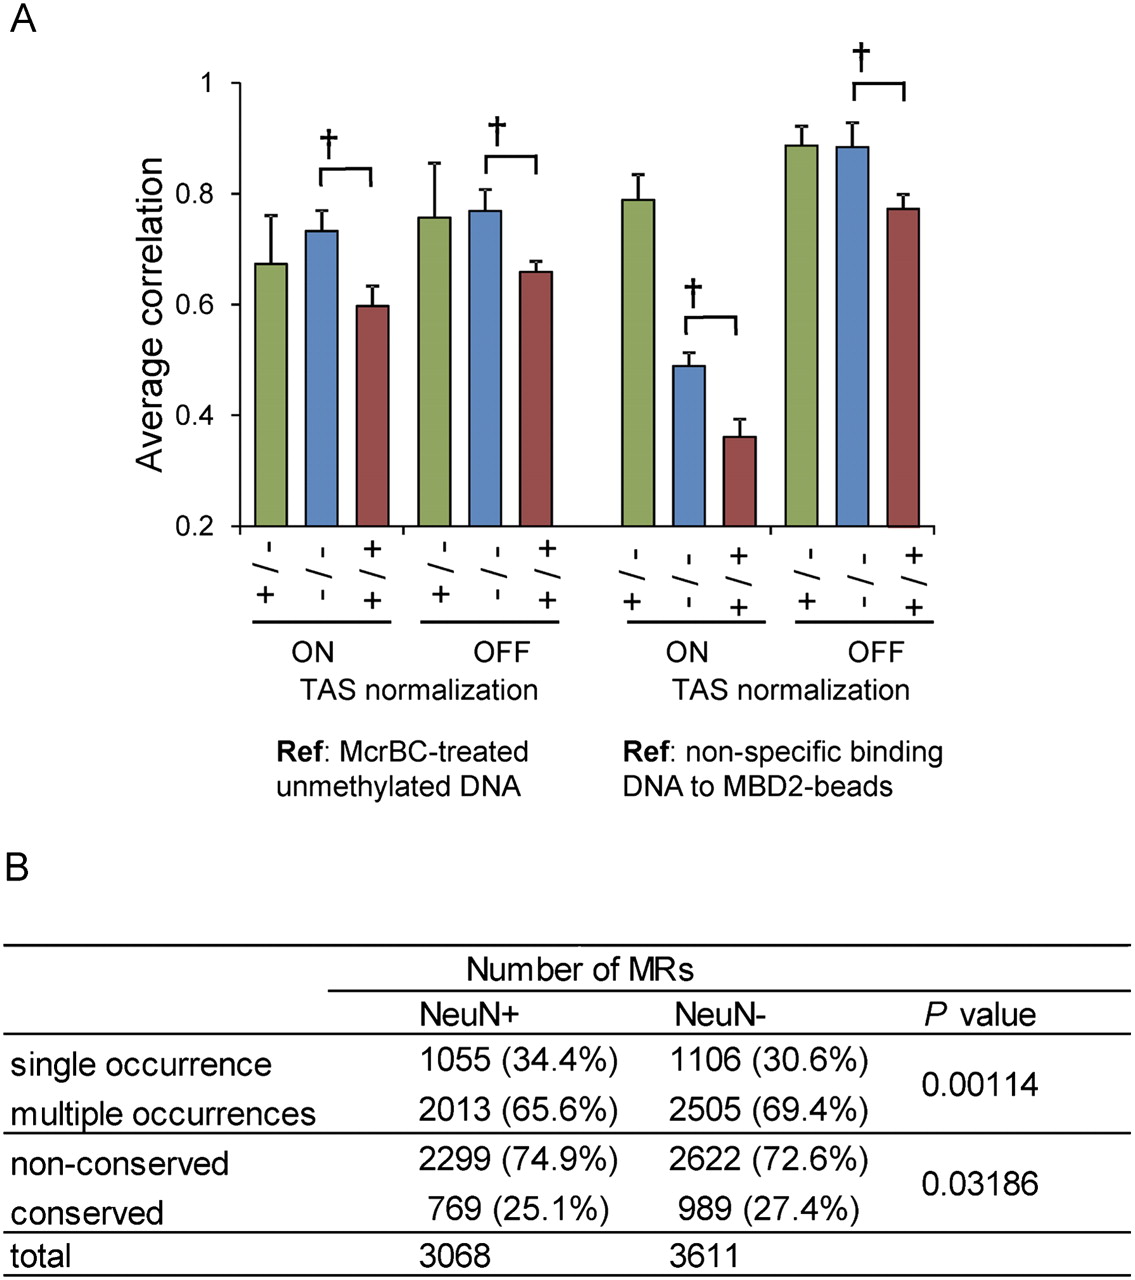
Variations in neuronal and non-neuronal methylation. (A) Average correlation of pairwise comparisons of signal intensities of all probes on the tiling array. Green bars indicate the average correlation coefficient between NeuN+ and NeuN− samples from the same subject (n = three pairs). Blue and red bars indicate the average correlation coefficient between NeuN− samples (n = six combinations) and between NeuN+ samples (n = six combinations), respectively. The dagger indicates P < 0.05 by the Student's t-test. Values are mean ± SD. (B) Interindividual variations of the location of neuronal and non-neuronal MRs. Number of MRs detected in various conditions are shown. Single occurrence: MRs found in only one subject. Multiple occurrences: MRs shared by two or all subjects. Nonconserved: MRs in one subject or shared by two subjects. Conserved: MRs shared by all subjects. P-values are determined by the Fisher exact test. Note that the number of shared MRs in three subjects differed from that represented in the text because of the exclusion of common MRs from every individual MR for this analysis (Supplemental Fig. 3).


