
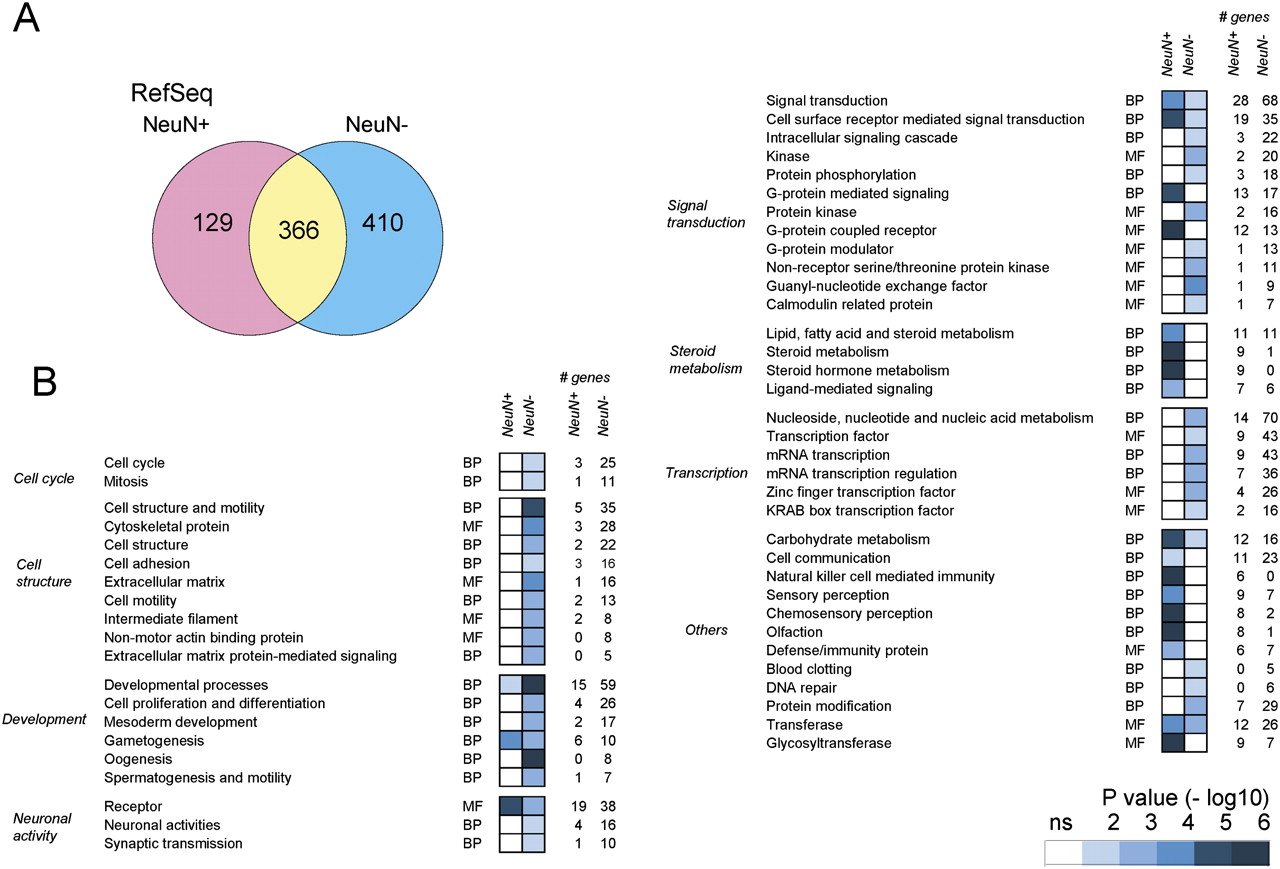
Figure 5.
Ontology and expression analysis of the genes associated with DNA methylation. (A) Venn diagrams of the RefSeq genes associated with MRs. Supplemental Tables 7–9 list the genes. (B) PANTHER ontology analysis of the genes associated with neuronal and non-neuronal MRs. The ontology terms are arbitrarily grouped based on their functions. (ns) Not significant; (BP) biologic process; (MF) molecular function.


