
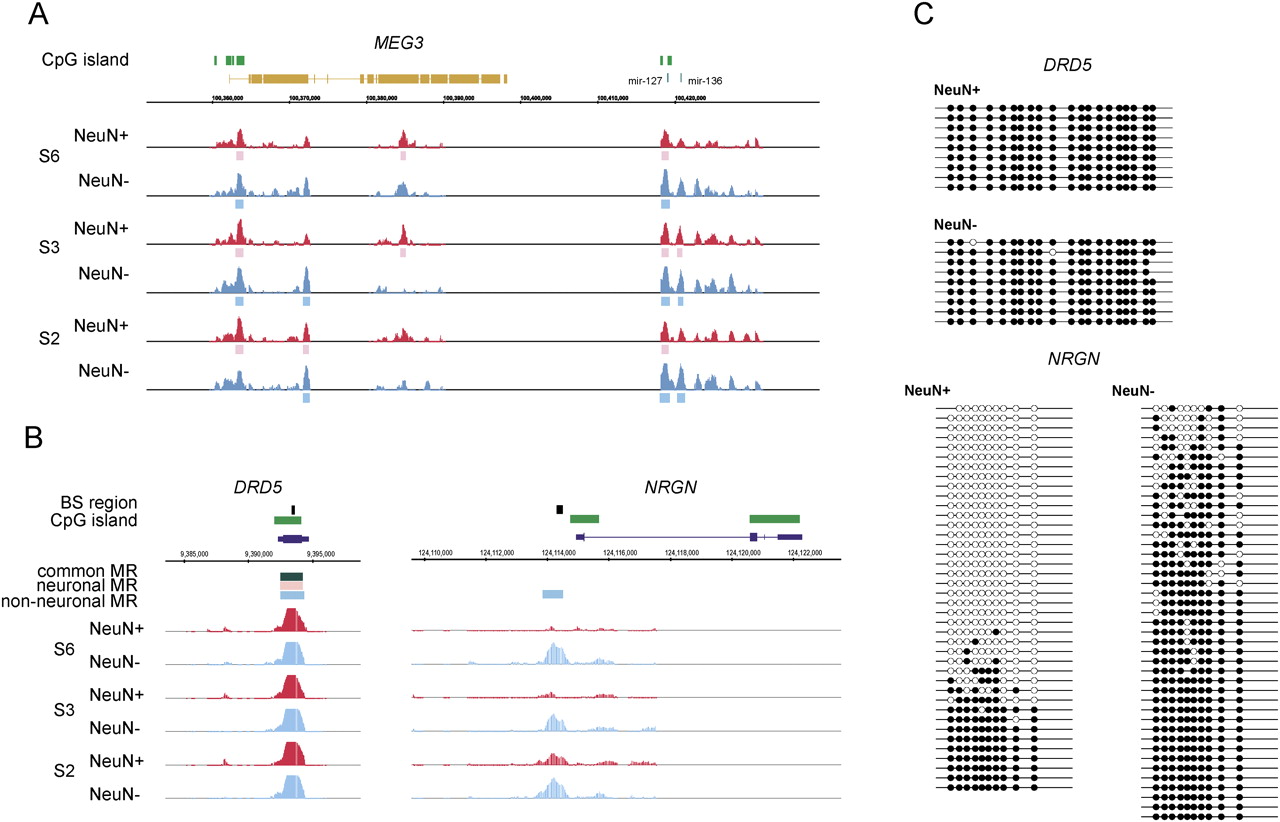
Promoter tiling array analysis. (A) Example of results of the methylation status of the imprinted gene, MEG3, and (B) commonly (DRD5, dopamine receptor 5) or differentially (NRGN, neurogranin) methylated genes. Exon structure of the MEG3 is illustrated in a collapsed manner. Individual MRs detected by the MAT analysis are shown in pink (neuronal) or light blue (non-neuronal) bars. Common MRs are shown in dark green. Supplemental Figure 5 shows the methylation status of other imprinted genes. (C) The results of bisulfite sequencing of DRD5 and NRGN. Our bisulfite sequencing analysis excluded the possibility that tiling array signals are derived from DRD5 pseudogenes. In addition, their methylation levels were separately analyzed (data not shown).


