
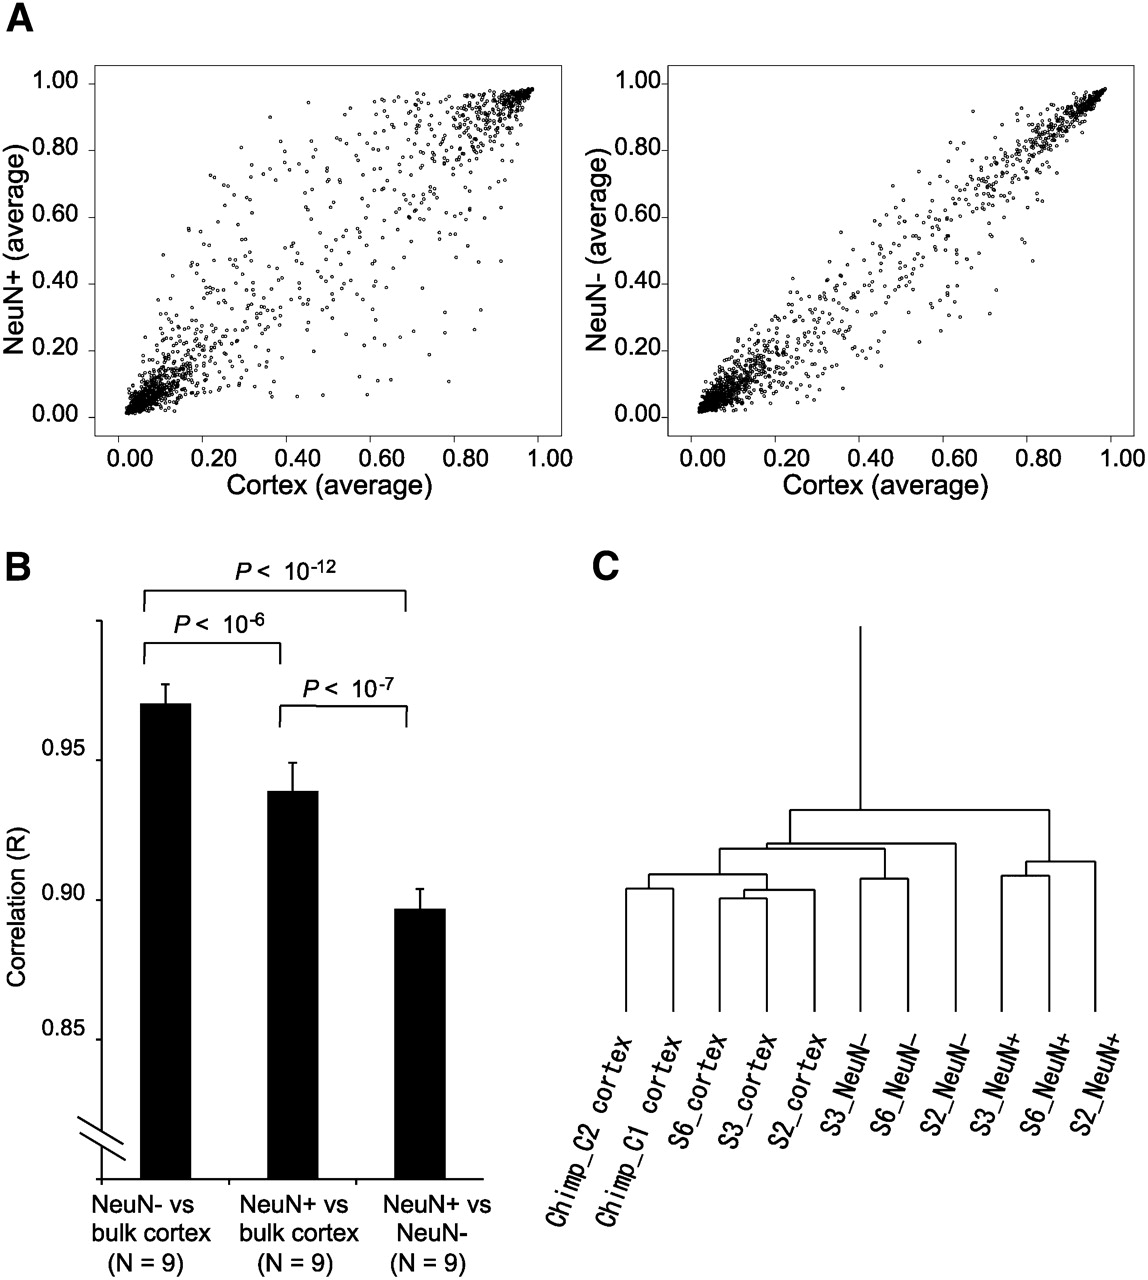
Figure 3.
Differential epigenetic signatures between neuronal and non-neuronal nuclei and evolutionary conservation of methylation status. The assay allowed quantification of DNA methylation levels at 1505 individual CpG sites chosen from 807 genes (Bibikova et al. 2006). (A) Scatter-plot of average methylation levels of the 1505 CpG sites. (B) Statistical comparison of correlation. Values are mean ± SD. (C) Hierarchical clustering based on the 833 CpG sites that showed an identical sequence with regard to the probe region between human and chimpanzee.


