
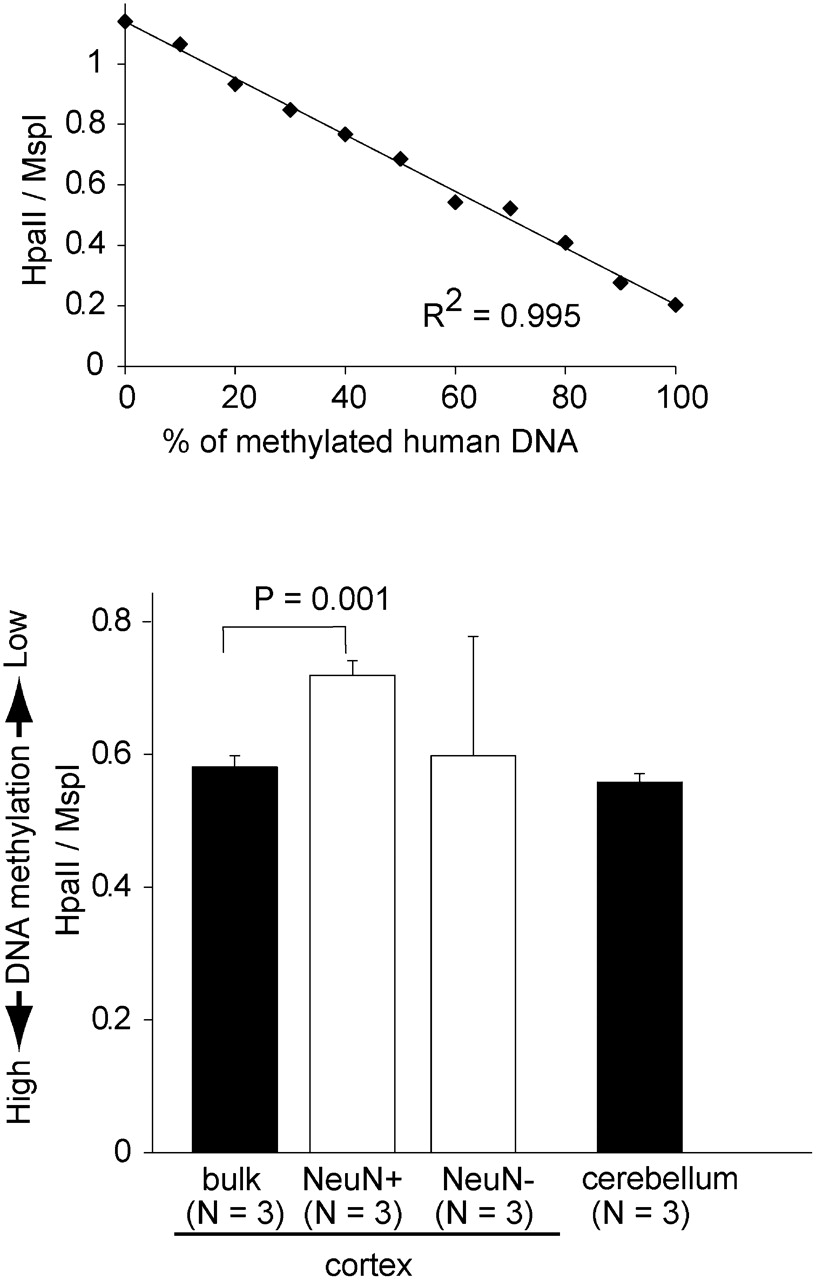
Figure 2.
Global DNA methylation assay by LUMA. (Top) HpaII/MspI ratio of the standard samples. (Bottom) HpaII/MspI ratio of the bulk and sorted brain samples. Theoretically, when all CCGG sites are not methylated, the ratio of HpaII/MspI is close to 1, whereas the ratio is expected to be close to 0 when all sites are methylated. To test the accuracy of the methods, we used samples containing various amounts of methylated and unmethylated genomic DNA as standard samples. Values are mean ± SD.


