
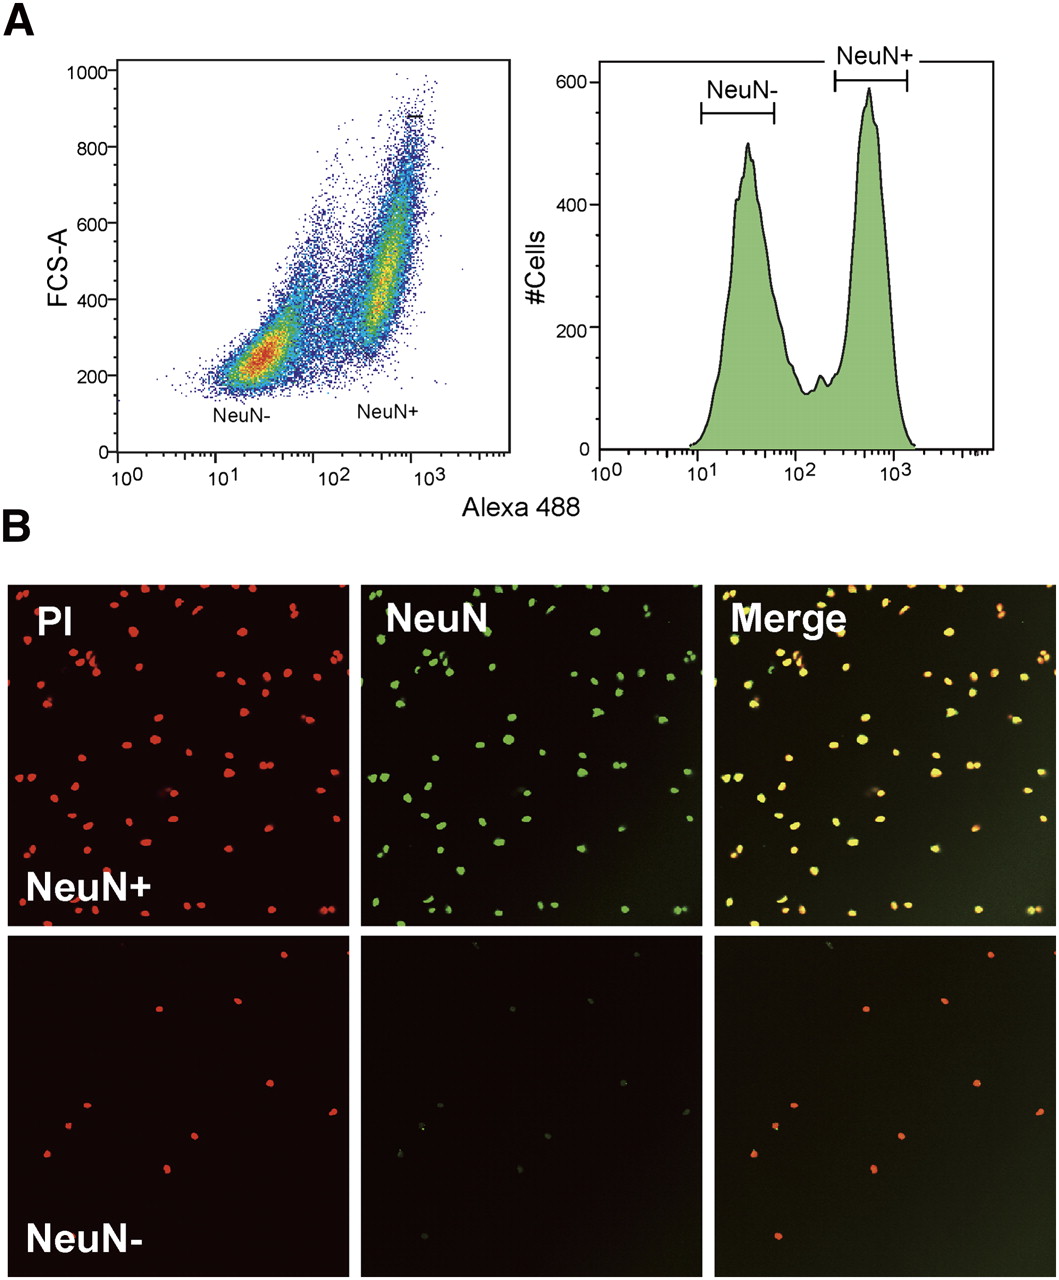
Figure 1.
Separation of neuronal and non-neuronal nuclei by FACS. (A) Typical example of the nuclei sorting based on Alexa Fluoro 488-conjugated anti-NeuN antibody. (B) Microscopic examination of isolated neuronal (NeuN+) and non-neuronal (NeuN−) nuclei. Note that the image did not reflect the yield because of the different levels of dilution.


