
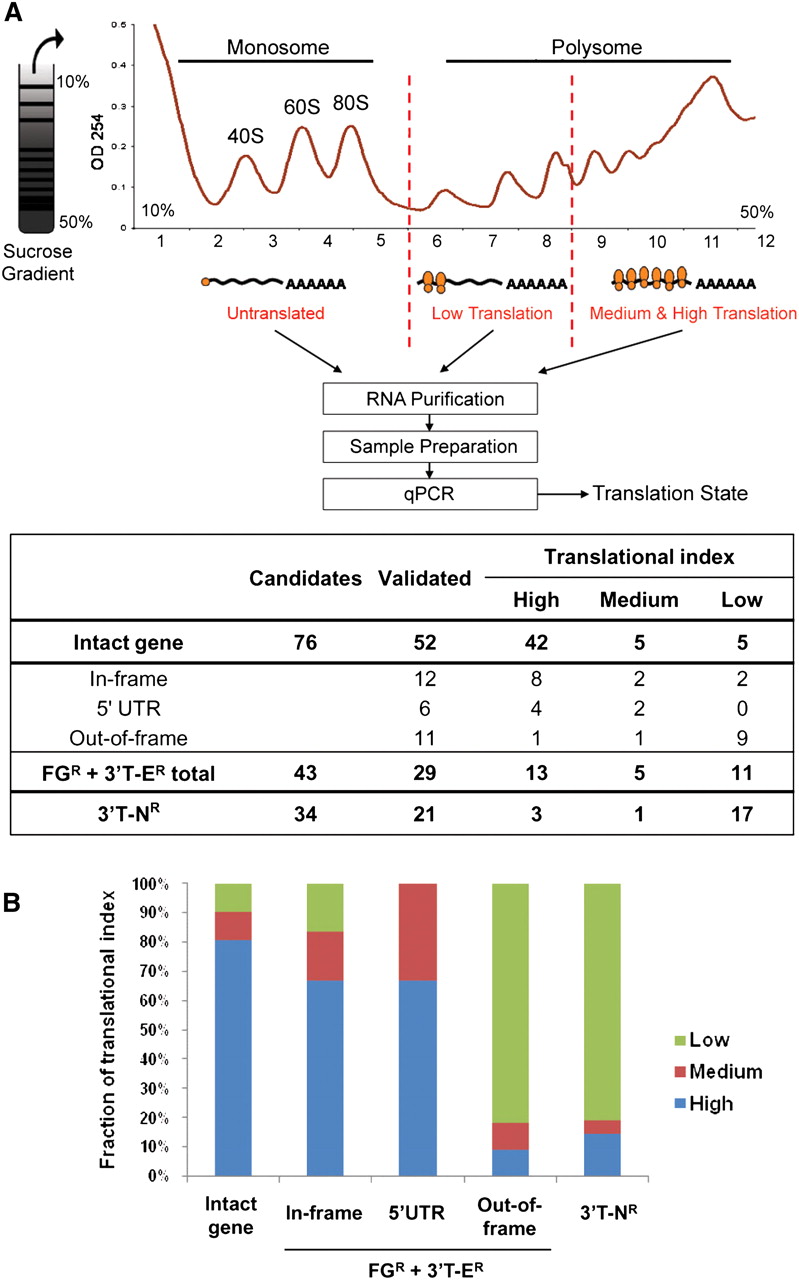
Translational index of fusion transcripts. (A) The figure depicts a typical sucrose gradient fractionation profile demonstrating the separation between translationally active polysomal RNA and the nontranslated monosomal RNA. The number of the ribosomes associated is an indication of its translational potential. The table below shows the numbers of candidates, validated transcripts, and results for the polysomal assay in MCF-7. Candidates include fusion point/splicing variants. ORF structures of each category are explained in Supplemental Figure 3A. The definition of translational index is given in Methods. (B) The fraction of translational index (Low, Medium, High) in each category showing a high translational index for in-frame fusion genes.


