
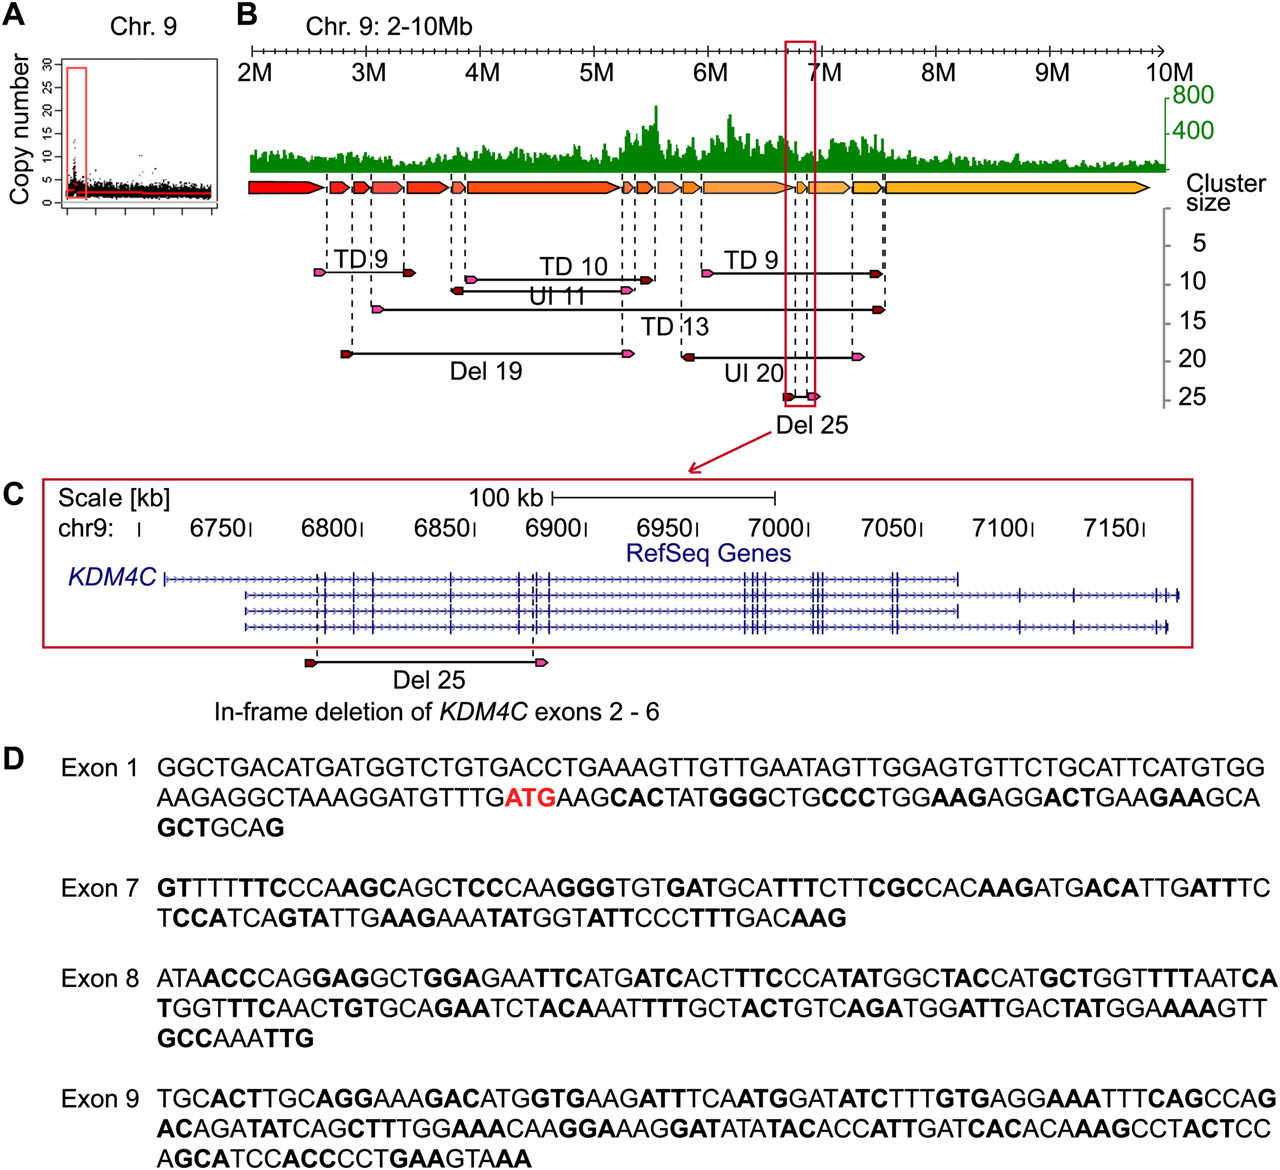
The architecture of an amplification in primary breast tumor 14. (A) Concordant tag based copy-number estimate for chromosome 9 indicates an amplification of the distal region of 9p. (B) Concordant tag distribution of chromosome 9 position 2–10 Mb (top, green track). Genomic segments between predicted breakpoints are indicated by colored arrows (middle) and dPET clusters with cluster sizes greater than eight are represented by horizontal lines flanked by dark red and pink arrows (bottom). Abbreviations for mapping characteristics of dPET clusters are described in Figure 4. (C) Genomic structure of KDM4C. Location of amplified deletion (Del25) is indicated by dashed vertical lines. (D) Sequencing result of RT–PCR confirms the in-frame deletion transcript with the more upstream located exon 1.


