
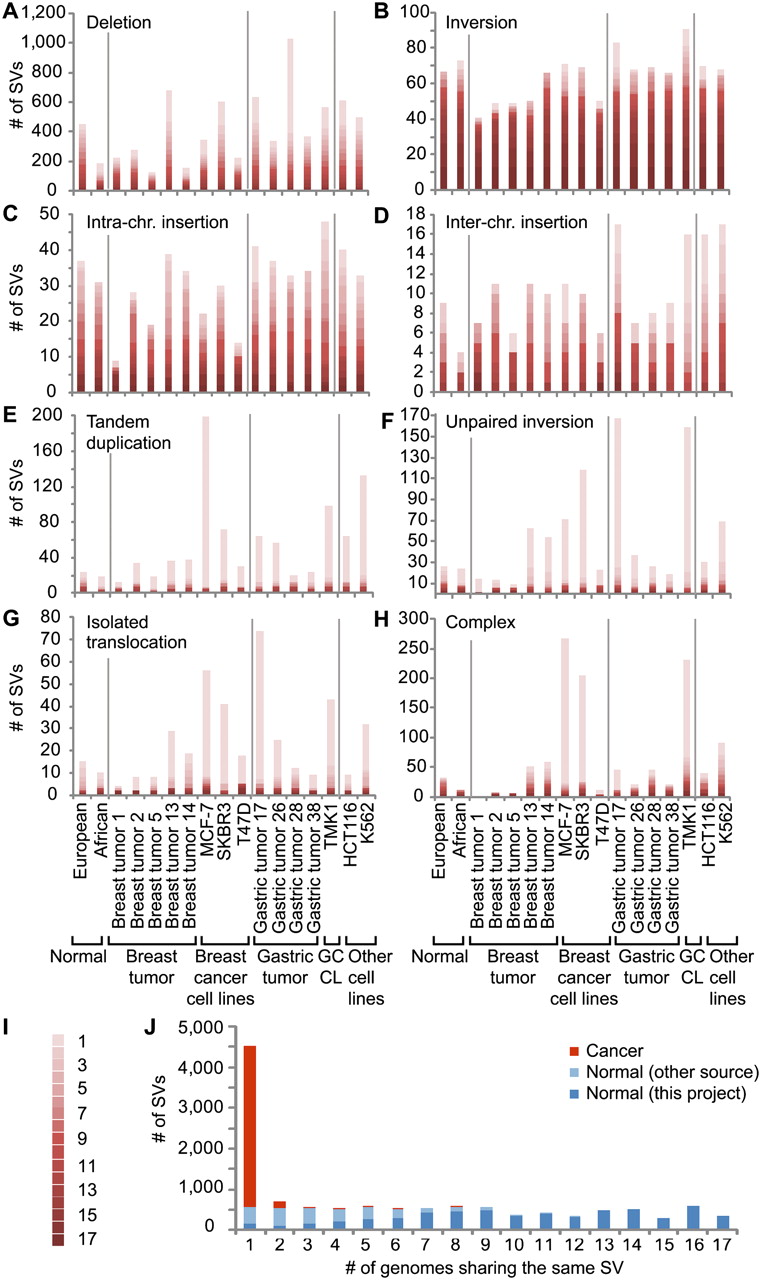
Comparison of SVs across 15 cancer and two normal genomes. (A–H) Frequencies (y-axis) of the indicated SV categories are shown for the individual genomes (x-axis). Cancer groups are separated by vertical gray lines. Degree of recurrent observation of the same SV is indicated in I, where 1 represents the observation in one genome and 17 represents the observation in all 17 genomes. (J) SVs that were observed in the normal individual(s) or which were observed in the cancer genomes, but match those observed in the normal individuals or match by >80% earlier described events (Korbel et al. 2007; Kidd et al. 2008) are indicated in dark blue. SVs that were also observed in the other 14 normal individuals are indicated in light blue. SVs observed only in cancer genomes are indicated in orange. The x-axis represents the number of genomes that share a particular SV, and the y-axis represents the frequency.


