
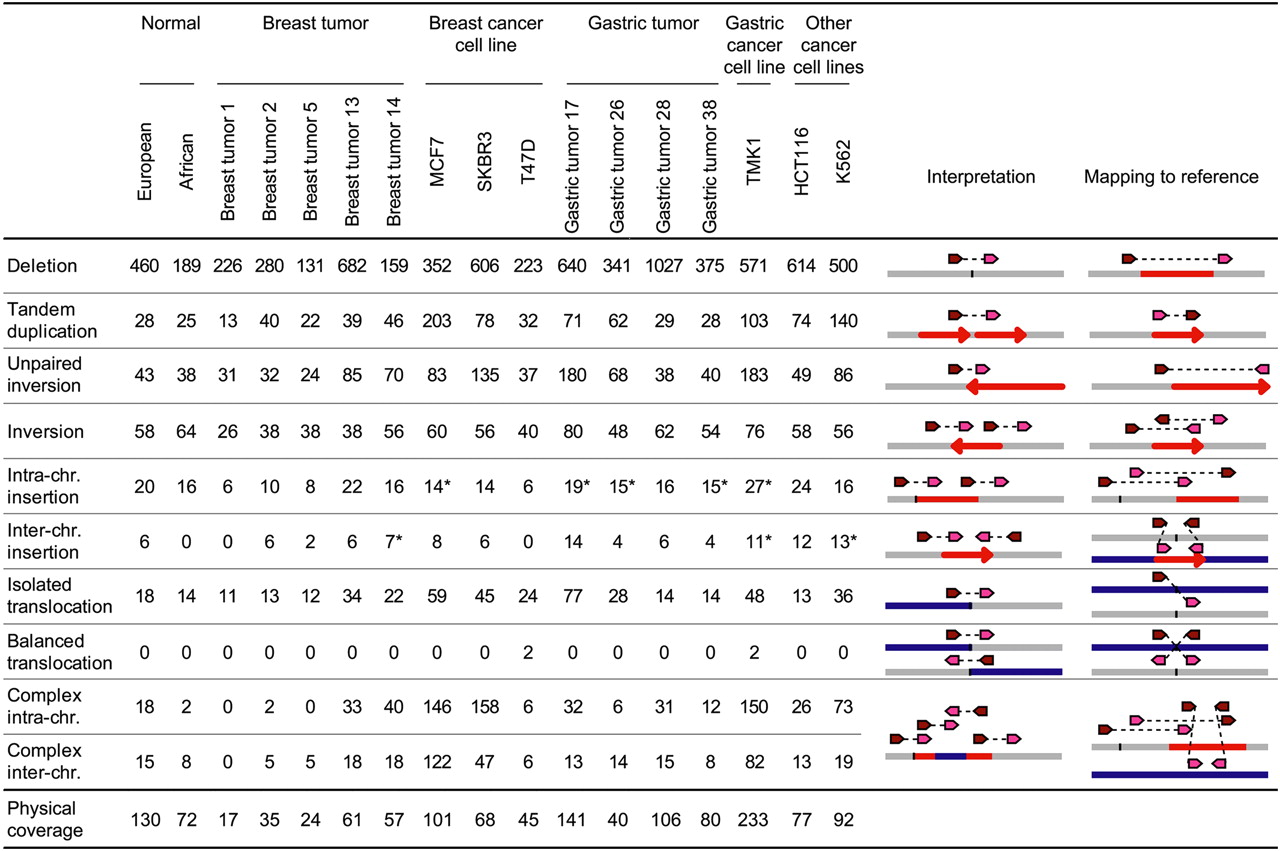
Figure 1.
Structural variations (SVs) identified by dPET clusters of 15 cancer and two normal genomes. Column “Interpretation” indicates the genomic structure of the sequenced genome deduced from the mapping pattern of the dPET clusters to the human reference sequence (mapping to reference). Dark red arrows represent 5′ anchor regions and pink arrows represent 3′ anchor regions. Gray, blue, and red horizontal lines represent chromosomal segments. Red arrows indicate orientation of chromosomal segments. Asterisks indicate that clusters have been used for more than one insertion.


