
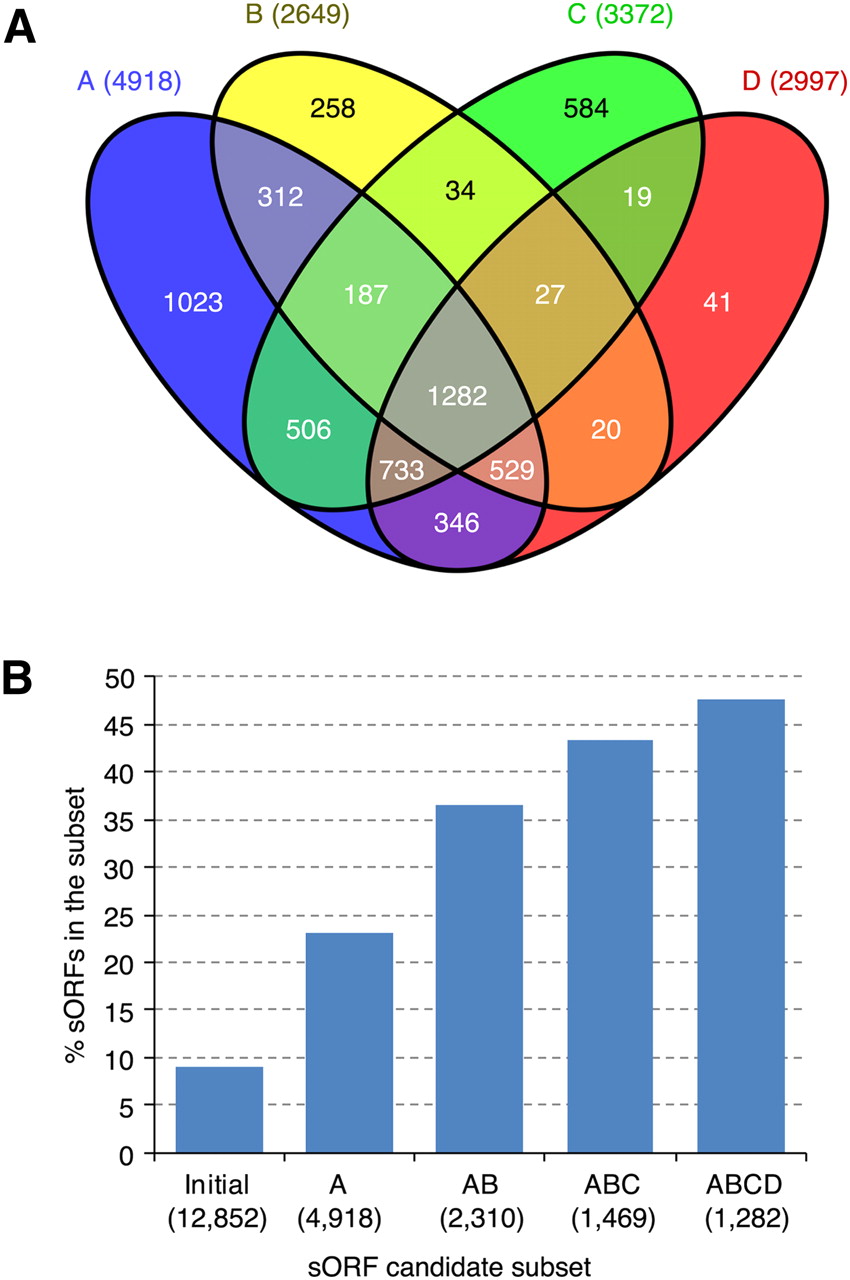
Figure 4.
Protein domain annotation of sORF candidates. (A) Venn diagram showing the number of sORF candidates in four different subsets and their intersections. (B) Proportion of the sORF subsets having protein mass spectrometry data support. The “Initial” set, Subsets A, B, C, AB, and ABC are as described in Figure 2. Subset D contains sORF candidates with known protein domains detected by InterProScan. (ABCD) (i.e., the higher-confidence sORF candidate set) The intersection of Subsets A, B, C, and D. The value in parentheses represents the number of sORFs in each individual subset.


