
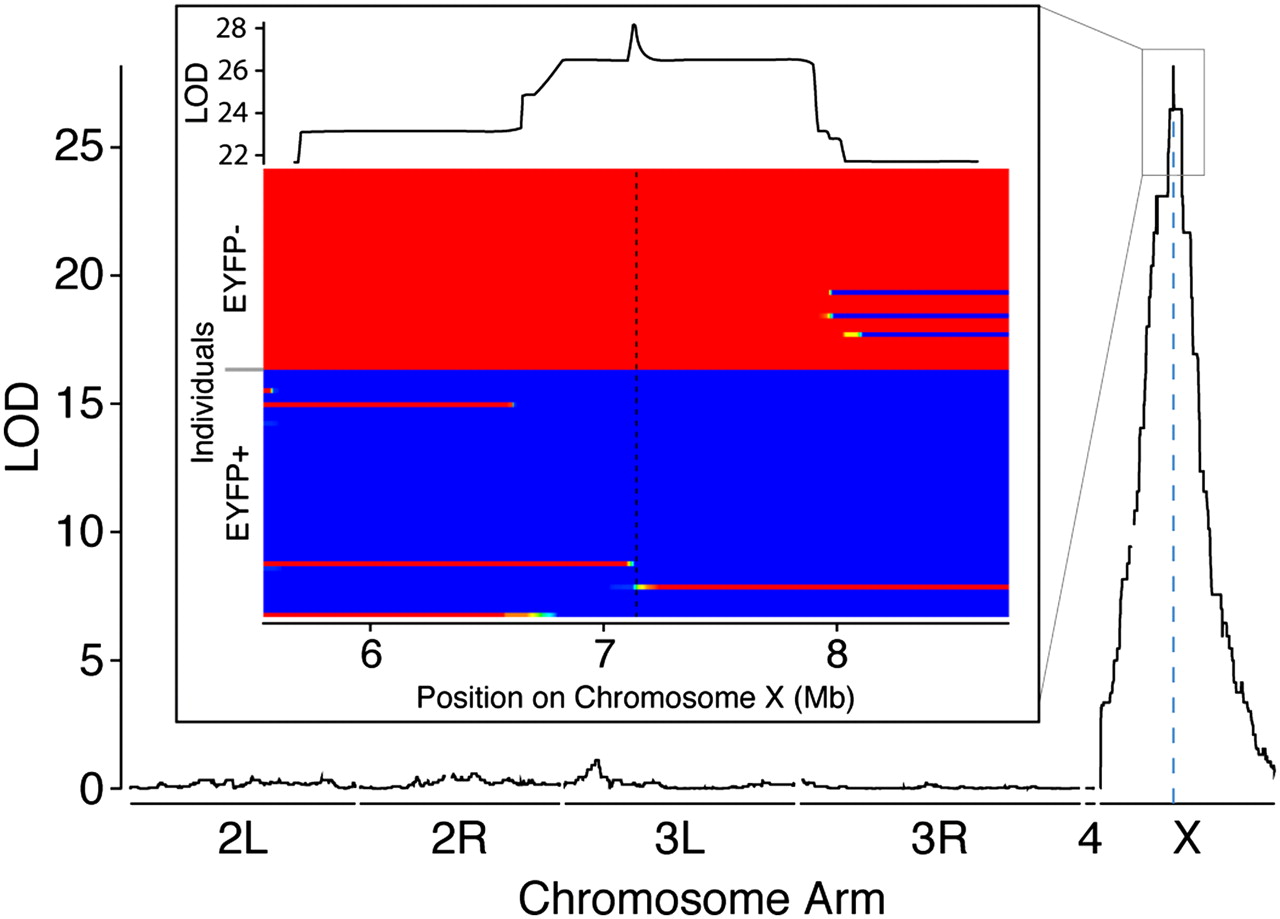
Figure 4.
QTL map of the location of a dominant marker segregating in the reported backcross experiment. The inset illustrates below the estimated ancestries for all individuals between genomic locations 5.5 Mb and 8.5 Mb on the X chromosome and, above, the LOD profile. Individual ancestry estimates are sorted into individuals without EYFP above and with EYFP below. Regions with posterior probabilities close to 1 of homozygous D. simulans are coded blue, and homozygous D. sechellia are coded red. Posterior probabilities between 0 and 1 are coded with colors intermediate between blue and red.


