
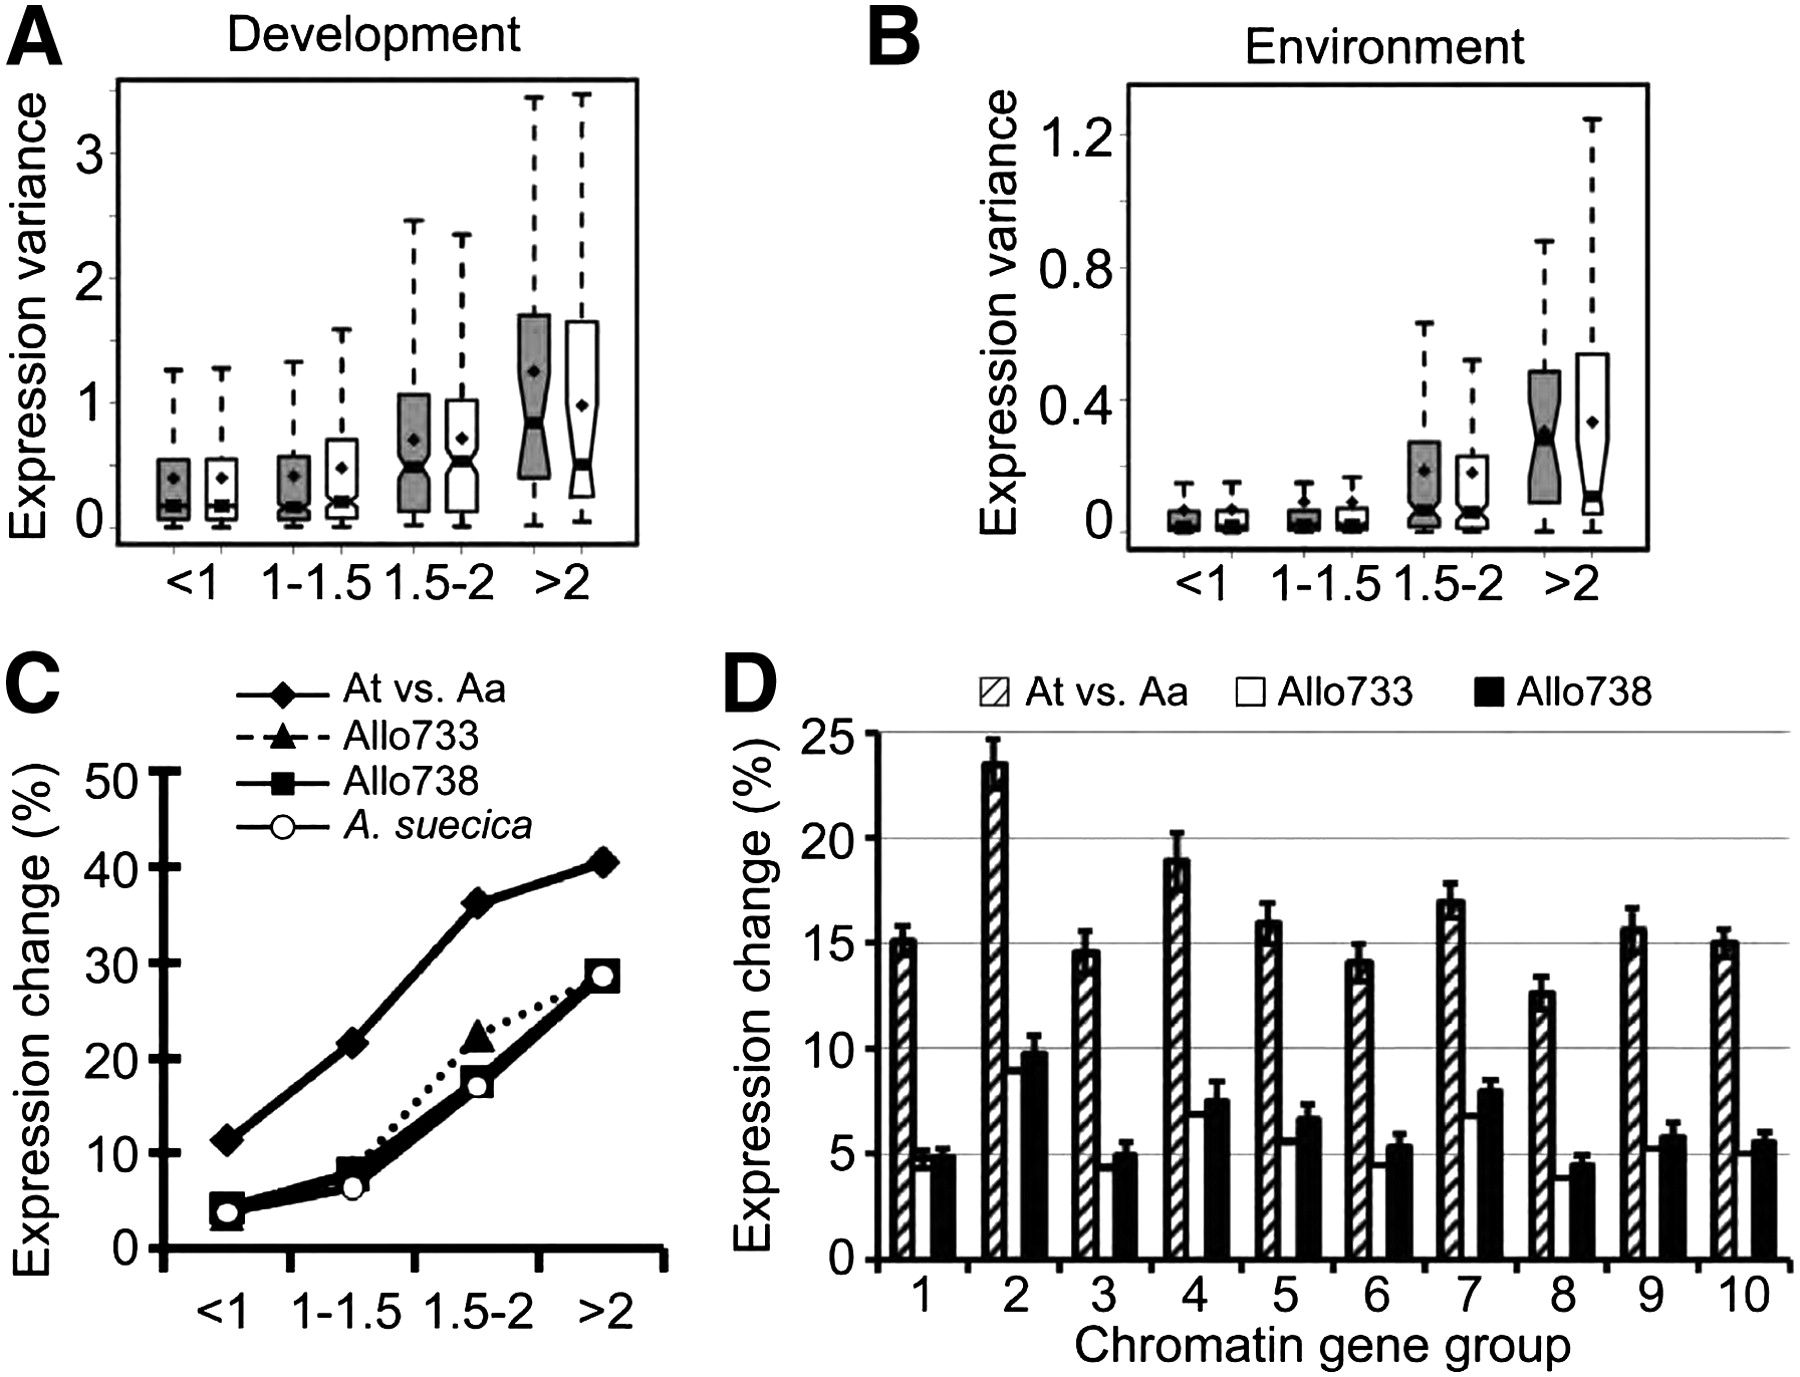
Histone deacetylase affects gene expression variation within and between Arabidopsis species. (A) Genes whose expression was affected by ATHD1 in leaves and flowers showed a high level of expression diversity among development stages. Diamond points indicate mean values of the expression variance. Notches of the boxplots indicate 95% confidence intervals of median values of the expression variance among 63 developmental stages. Genes up-regulated in athd1-t1 leaves (gray boxplots) and flowers (open boxplots). Numbers under the x-axis represent the fold changes of gene expression in athd1-t1 compared to the wild type. (B) Genes highly affected by ATHD1 defect in leaves and flowers of A. thaliana show a high expression variance in response to various environmental changes. The expression variance of each gene (y-axis) was calculated from 63 combinations of environmental changes and time points after treatments. Genes up-regulated in athd1-t1 leaves (gray boxplots) and flowers (open boxplots) with a range of expression fold changes (x-axis). (C) Histone acetylation and deacetylation target genes tend to change expression levels between closely related species and in allotetraploids. The logistic regression analyses were conducted for gene expression changes between A. thaliana and Arabidopsis arenosa (diamond), between a resynthesized allotetraploid (Allo733) and mid-parent value (MPV) (triangle), between Allo738 and MPV (square), and between the natural allotetraploid Arabidopsis suecica and MPV (circle), relative to the expression fold changes (x-axis). (D) Boxed bars represent the proportion of genes differentially expressed between A. thaliana and A. arenosa (slashed), Allo733 and MPV (open), and Allo738 and MPV (filled). Standard deviations were calculated by 10,000 bootstrapping replicates.


