
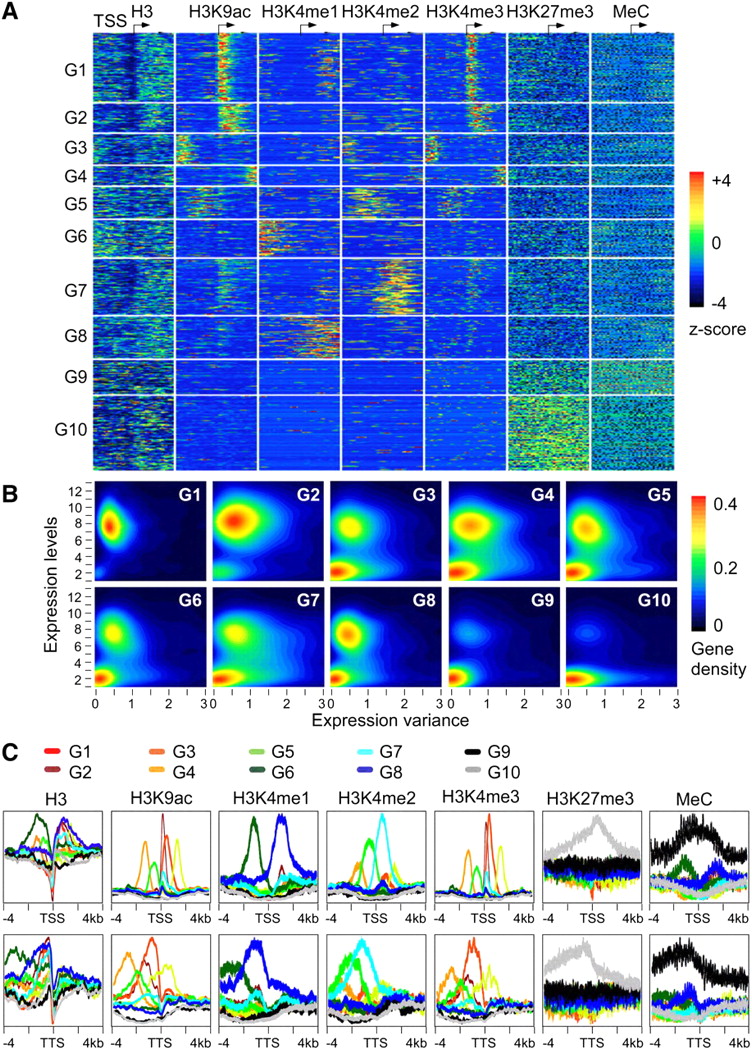
Distinctive patterns of chromatin modifications around the TSS are associated with transcription levels and expression variation of genes in Arabidopsis. (A) Clustering of genes into 10 groups (G1 to G10) using the unsupervised PAM algorithm and chromatin modification patterns around TSS. Standardized mean densities of histone modifications flanking the TSS in each cluster group were plotted at 1-bp resolution. The occupancy density of each chromatin modification was standardized to yield a distribution with mean = 0 and variance = 1 using ChIP-seq (H3, H3K9ac, and H3K4me3) and ChIP-chip (H3K4me1, H3K4me2, H3K27me3, and MeC) data. All genes were aligned around the TSS and sorted by groups after clustering analysis based on their chromatin modification densities in a 100-bp window using PAM (k = 10). (B) The kernel density (gene density from 0 to 0.4) of the genes in each group (G1 to G10) was plotted using gene expression levels in leaves (y-axis) versus gene expression variance in 63 developmental stages (x-axis). (C) Gene expression variation was associated with chromatin modifications. Ten groups (G1 to G10) of genes with distinct chromatin modification patterns were plotted within a 4-kb region flanking the TSS or the TTS.


