
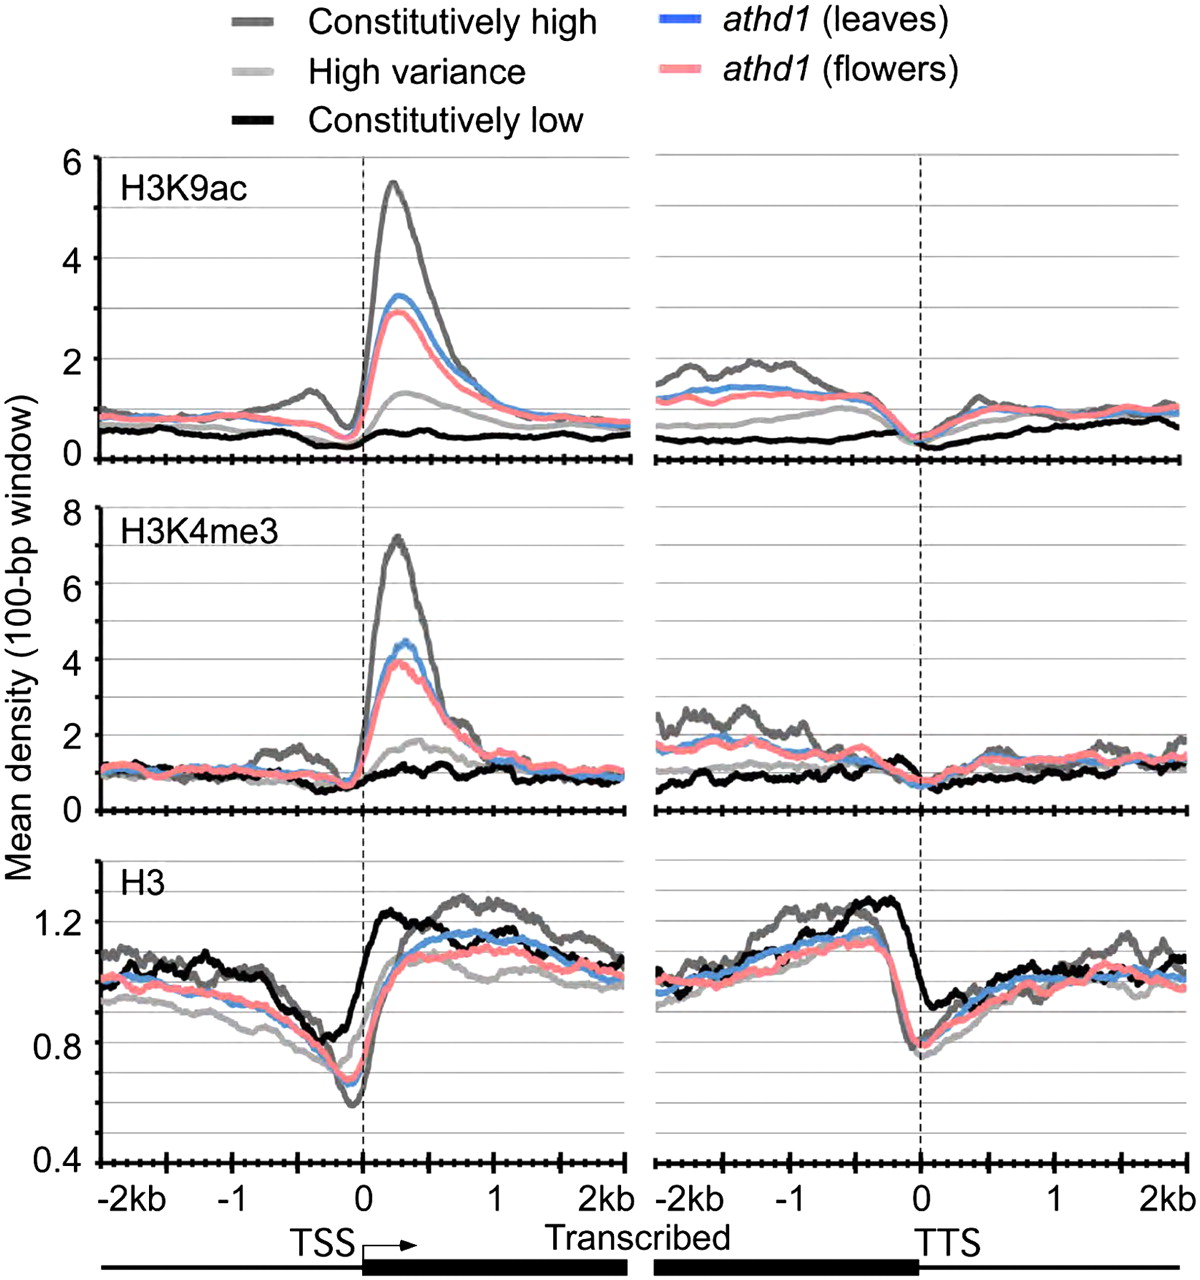
Figure 2.
H3K9ac, H3K4me3, and nucleosome densities are correlated with gene expression variations during development. Mean-normalized ChIP-seq densities of 1-bp resolution (y-axis) were plotted within a 4-kb region flanking the TSS or the TTS (x-axis). Genes with the top 10% expression levels (dark gray plots), the lowest 10% expression levels (black plots), and the top 10% highest expression variance (light gray plots), across 63 developmental stages. Genes that were up-regulated in athd1-t1 leaves (blue plots) and flowers (pink plots).


