
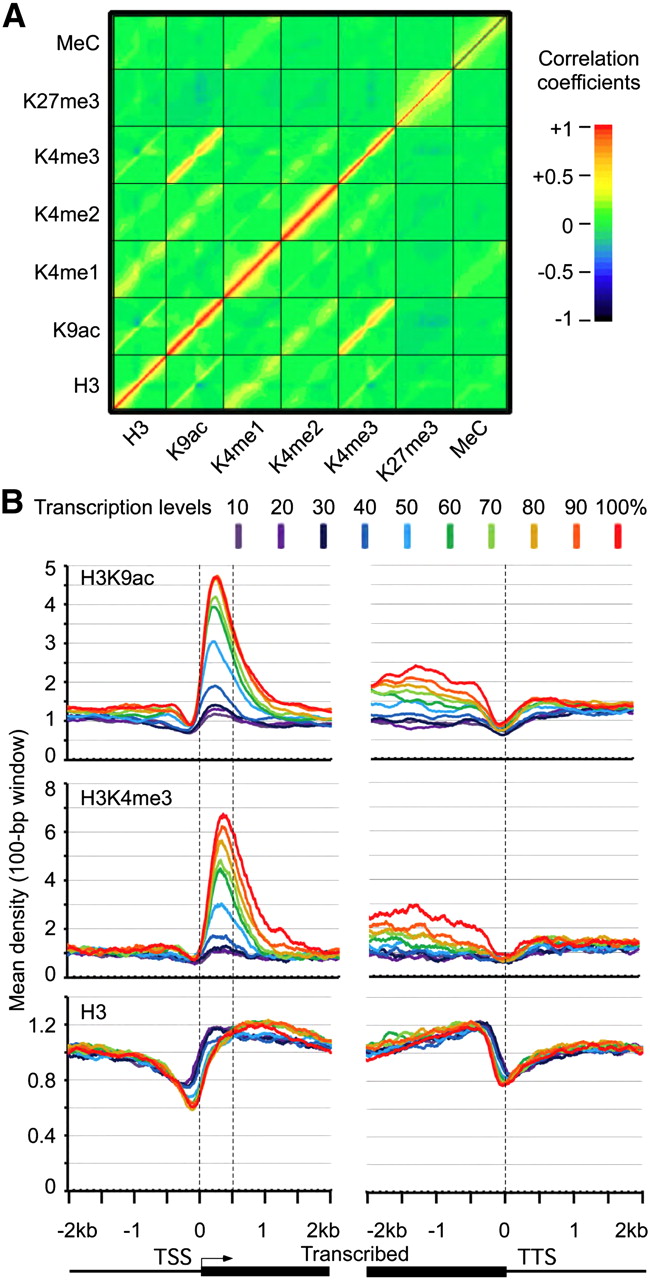
Histone modifications and DNA methylation and their effects on gene expression variation. (A) Density plot of correlation coefficients between H3, H3K9ac, H3K4me1, H3K4me2, H3K4me3, H3K27me3, and cytosine methylation (MeC) around the TSS. The x-axis and y-axis in each square (modification) represent the distribution frequency of mapped reads from −2 kb to +2 kb around the TSS. (B) Mean densities of H3K4me3 and H3K9ac within 500-bp downstream from TSS (y-axis) are correlated with the transcription level of genes from −2 kb to +2 kb (x-axis). A total of 26,000 genes were divided into 10 groups based on their transcription levels in leaves, from the top 10% (red) to the lowest 10% (deep purple). Mean-normalized ChIP-seq densities of 1-bp resolution were plotted within a 4-kb region flanking the TSS or the transcription termination sites (TTS). The densities of H3K4me3 and H3K9ac in the region between dotted lines (TSS and TTS) showed significant positive correlation with the transcription levels of genes, whereas H3 densities in the same region are negatively correlated with the transcription level.


