
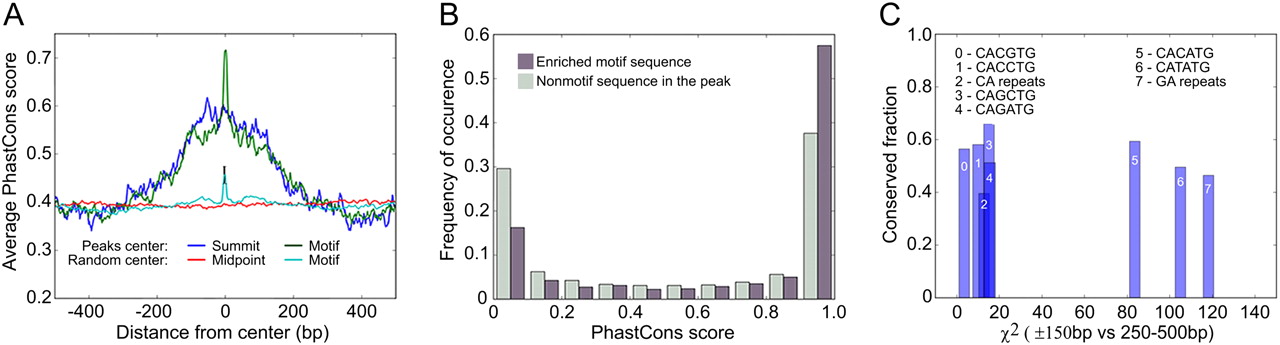
Conservation analysis of sequences defined by Twist binding. (A) Averaged conservation profiles using phastCons scores for ChIP-seq regions and random genome samples. The blue curve shows average conservation in ChIP-seq peak regions is significantly elevated ±150–200 bp from the ChIP-seq signal summit. The green curve shows the same data but with regions recentered over the nearest CABVTG binding motif within 150 bp of the original summit. For the random sample, 500 regions containing one of the motifs were selected with the region start point selected at random for the uncentered distribution. Here “midpoint” refers to the location in the center of the randomly determined region. The error bar shows two standard deviations of 30 trials of 500 samples each. A maximum over the motifs is manifest, though substantially smaller than within the ChIP-seq peak regions. (B) Histogram of phastCons scores for bp occurring within the 6 E-box binding motif candidates (gray) compared to that for bp within the ChIP-seq regions, but outside any of the E-box motifs (black). Bp in the motif sites are found to be statistically more conserved than bp outside of motifs (0.005 significance level). (C) Fraction of sites in various sequence patterns falling within the top decile of phastCons scores for a 150 bp radius surrounding ChIP-seq summits versus the chi squared statistic for distributions within 150 bp of the summit compared to those of region 250–500 bp from the summit. CACATG, CATATG, and GA repeat sequences exhibit significantly greater conservation in ChIP-seq regions compared to flanking sequence than other motifs (as shown by their clustering at high values of the chi squared statistic), though CATATG and GA repeats do not exhibit high absolute levels of conservation.


