
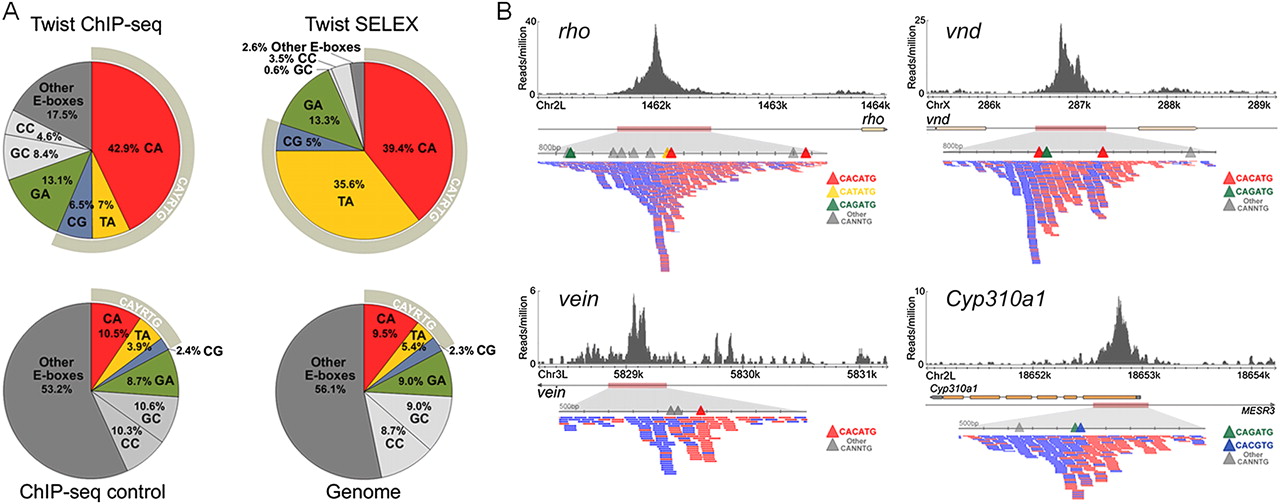
Figure 2.
A comparison of Twist in vivo and in vitro binding preferences. (A) The frequency of E-boxes associated with HC twist peaks (±50 bp), SELEX-bound sequences, ChIP-seq enriched control regions (±50 bp of summits), and the non-repeat dm3 genome was calculated. (B) Twist ChIP-seq data in the vicinity of CRMs shown to support expression of the genes rho (Ip et al. 1992b), vnd (Stathopoulos et al. 2002), vein (Markstein et al. 2004), and Cyp310a1 (this work). The directionality within ChIP-seq sequencing reads points to the position of the “explanatory” site. Blue and red ticks symbolize individual sequencing reads acquired, which match either the Watson or Crick strand.


