
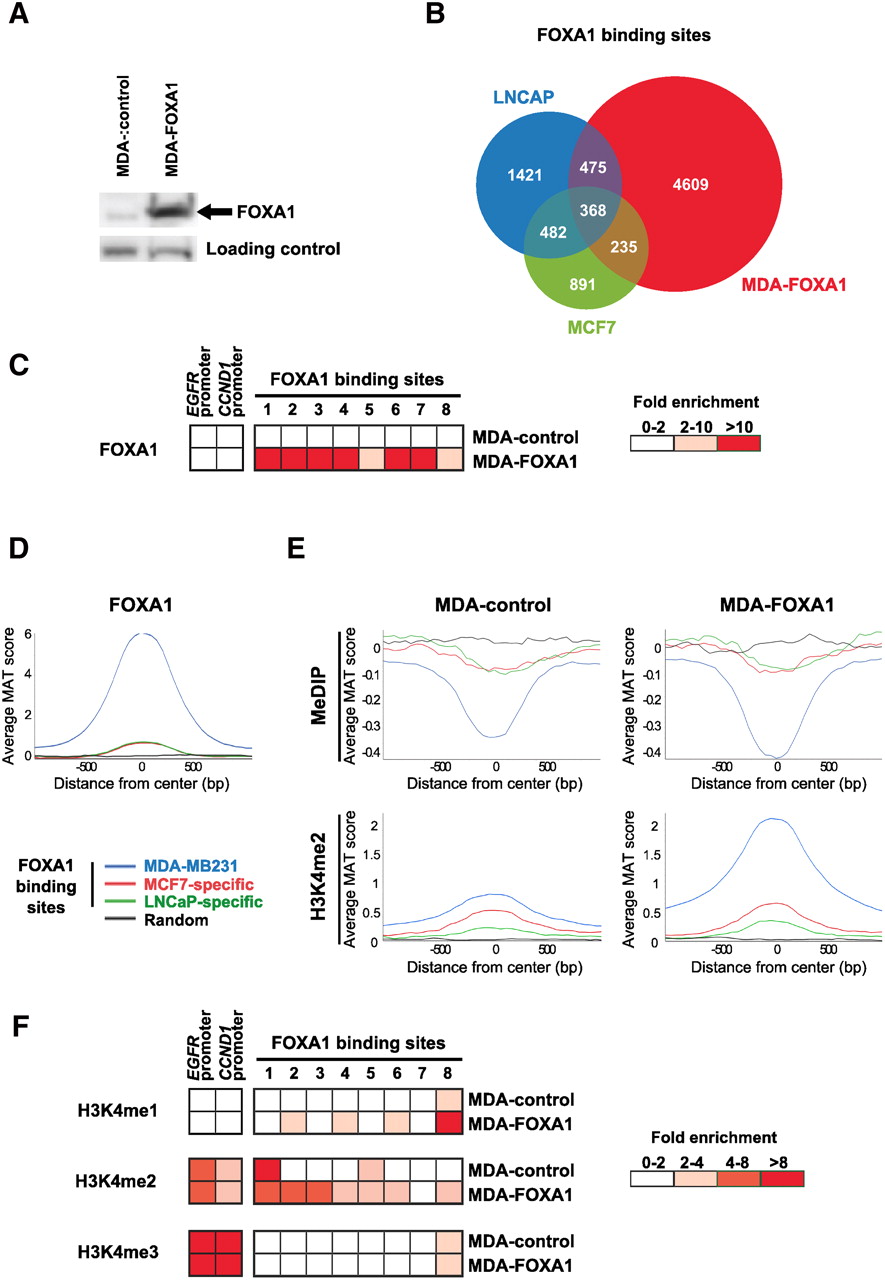
FOXA1 preferentially binds to DNA hypomethylated sites when ectopically expressed in MDA-MB231 cells. (A) Western blot assay showing FOXA1 expression in stably transfected MDA-MB231 cells (MDA-FOXA1). Note that only a faint non-specific band of lower molecular weight is observed in MDA-MB231 cells stably transfected with an empty vector (MDA-control) when the anti-FOXA1 antibody was used. (B) Peaks of FOXA1 enrichment were called using MAT at FDR 1% in MDA-FOXA1 cells and compared to those previously identified in MCF7 and LNCaP cells. Numbers of overlapping and non-overlapping binding sites are indicated on the Venn diagram. (C) ChIP-qPCR validation of eight sites identified by FOXA1 ChIP-chip in MDA-FOXA1. Fold enrichments relative to negative control regions are indicated. Results are from two independent experiments. (D) Average FOXA1-binding levels at MDA-MB231, MCF7-specific, or LNCaP-specific FOXA1 peaks were determined from ChIP-chip data obtained in MDA-FOXA1 cells. A random set of regions from chromosomes 8, 11, and 12 was also analyzed. (E) Average DNA methylation and H3K4me2 levels at FOXA1-binding sites from MDA-FOXA1 cells or at sites specific to MCF7 or LNCaP cells. MeDIP-chip or H3K4me2 ChIP-chip data were obtained in MDA-control or MDA-FOXA1 cells, as indicated. A random set of regions was used as control. (F) ChIP-qPCR experiments were performed in both MDA-control and MDA-FOXA1 cells to determine H3K4me1, 2, and 3 levels at FOXA1-binding sites validated in panel C. Fold enrichments relative to negative control regions are indicated. Results are from three independent experiments.


