
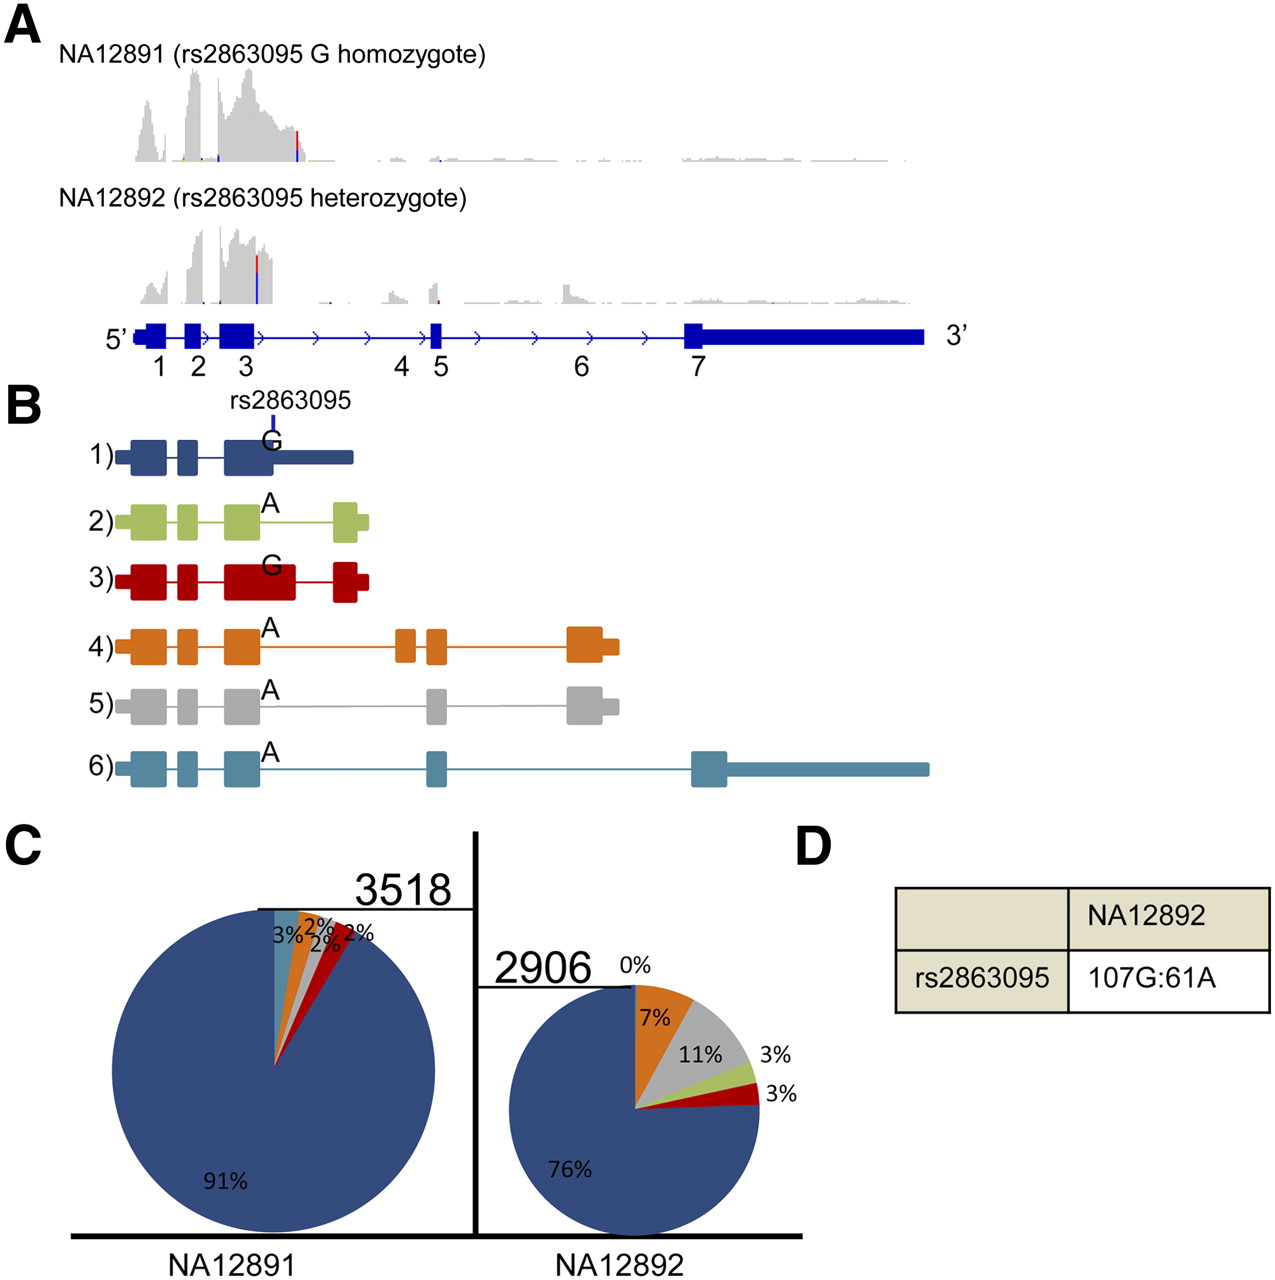
Isoform eQTLs found in MRPL43. (A) Screenshots from IGV displaying the read coverage within MRPL43. The maximum height of both tracks is 370. (B) Various isoforms detected in MRPL43 and their allele specificity (if any) to SNP rs2863095. (C) Relative percentages of isoforms (color-coded as in B) seen within individuals NA12891 and NA12892. Expression of each isoform was measured by counting the number of reads mapping to a junction specific for most isoforms (junction 3-3a for isoform 2; junction 3′-3a for isoform 3; junction 3-4 for isoform 4; junction 5-7 for isoform 6). For isoform 1, the expression was estimated as the number of reads mapping 110 bp after exon 3, since it is the only isoform that should be expressed at this point. The expression of isoform 5 was deduced by subtracting the number of reads supporting isoform 6 from the number of reads spanning junction 3-4, since they are the two isoforms using this splice junction. The height of each pie chart is representative of the gene expression for MRPL43. (D) Ratio of reference to alternate alleles seen in individual NA12892.


