
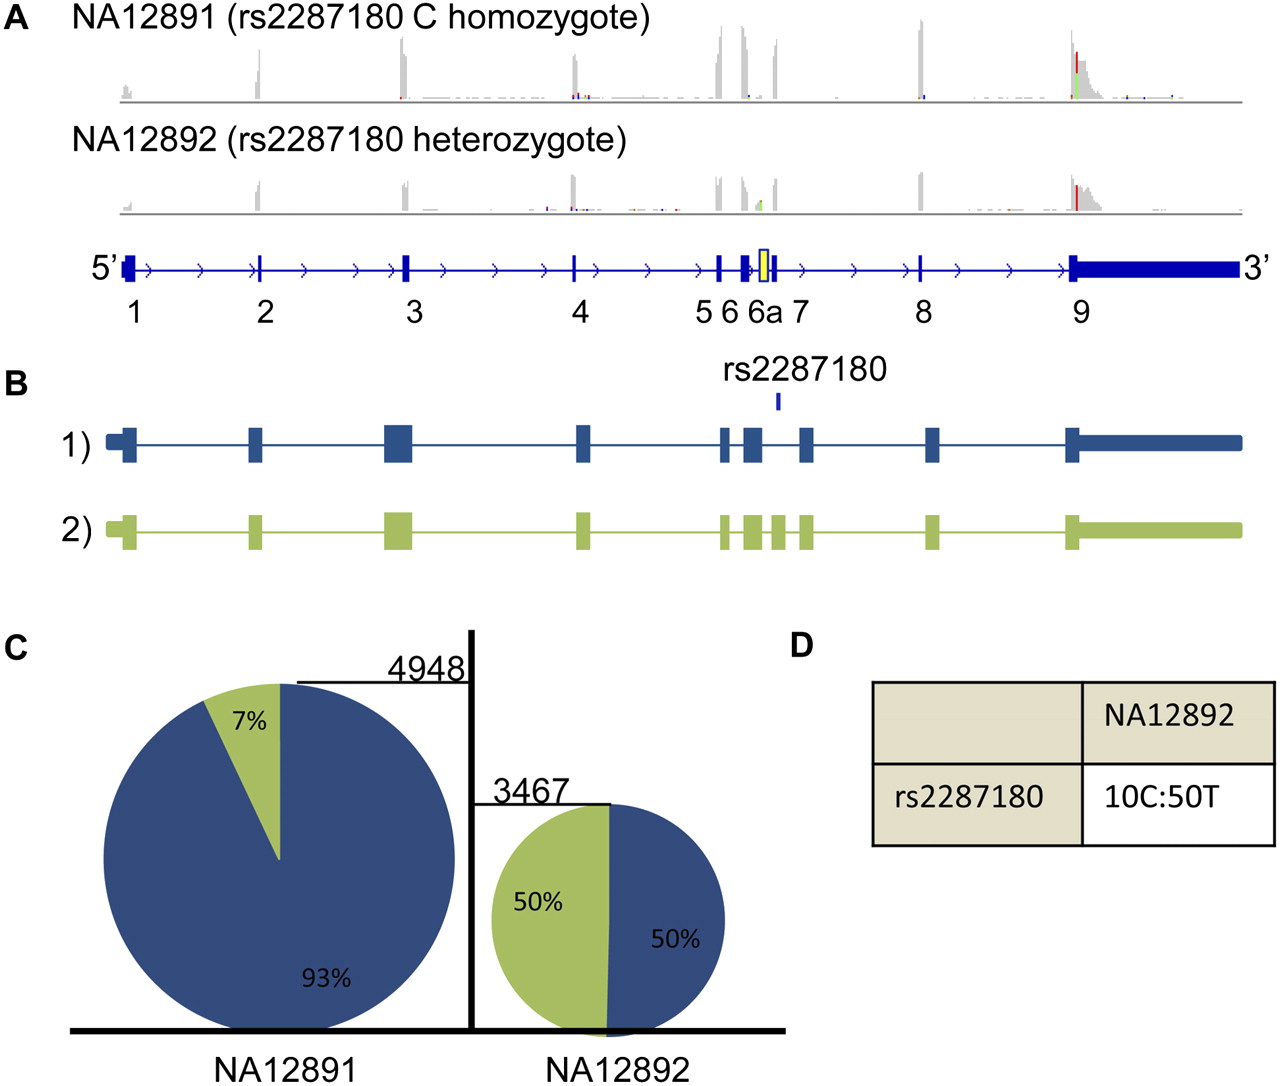
Correlation of SNP rs2287180 to overall MMAB transcript expression and to expression of MMAB novel exon 6a. (A) Screenshots taken from IGV illustrating the read coverage of MMAB. The maximum height for both tracks is set to 700. (B) The different MMAB isoforms seen in the alignment. (C) The percentage of transcripts (color-coded as in B) including and excluding exon 6a in NA12891 and NA12892. To measure the transcripts including exon 6a, the number of reads mapping to the junctions 6-6a and 6a-7 was averaged, and to measure the number of transcripts excluding exon 6a, the number of reads mapping to junction 6-7 were counted. The height of each pie chart is representative of the gene expression for MMAB. (D) The number of reads supporting the reference and alternate alleles for rs2287180, respectively, in individual NA12892.


