
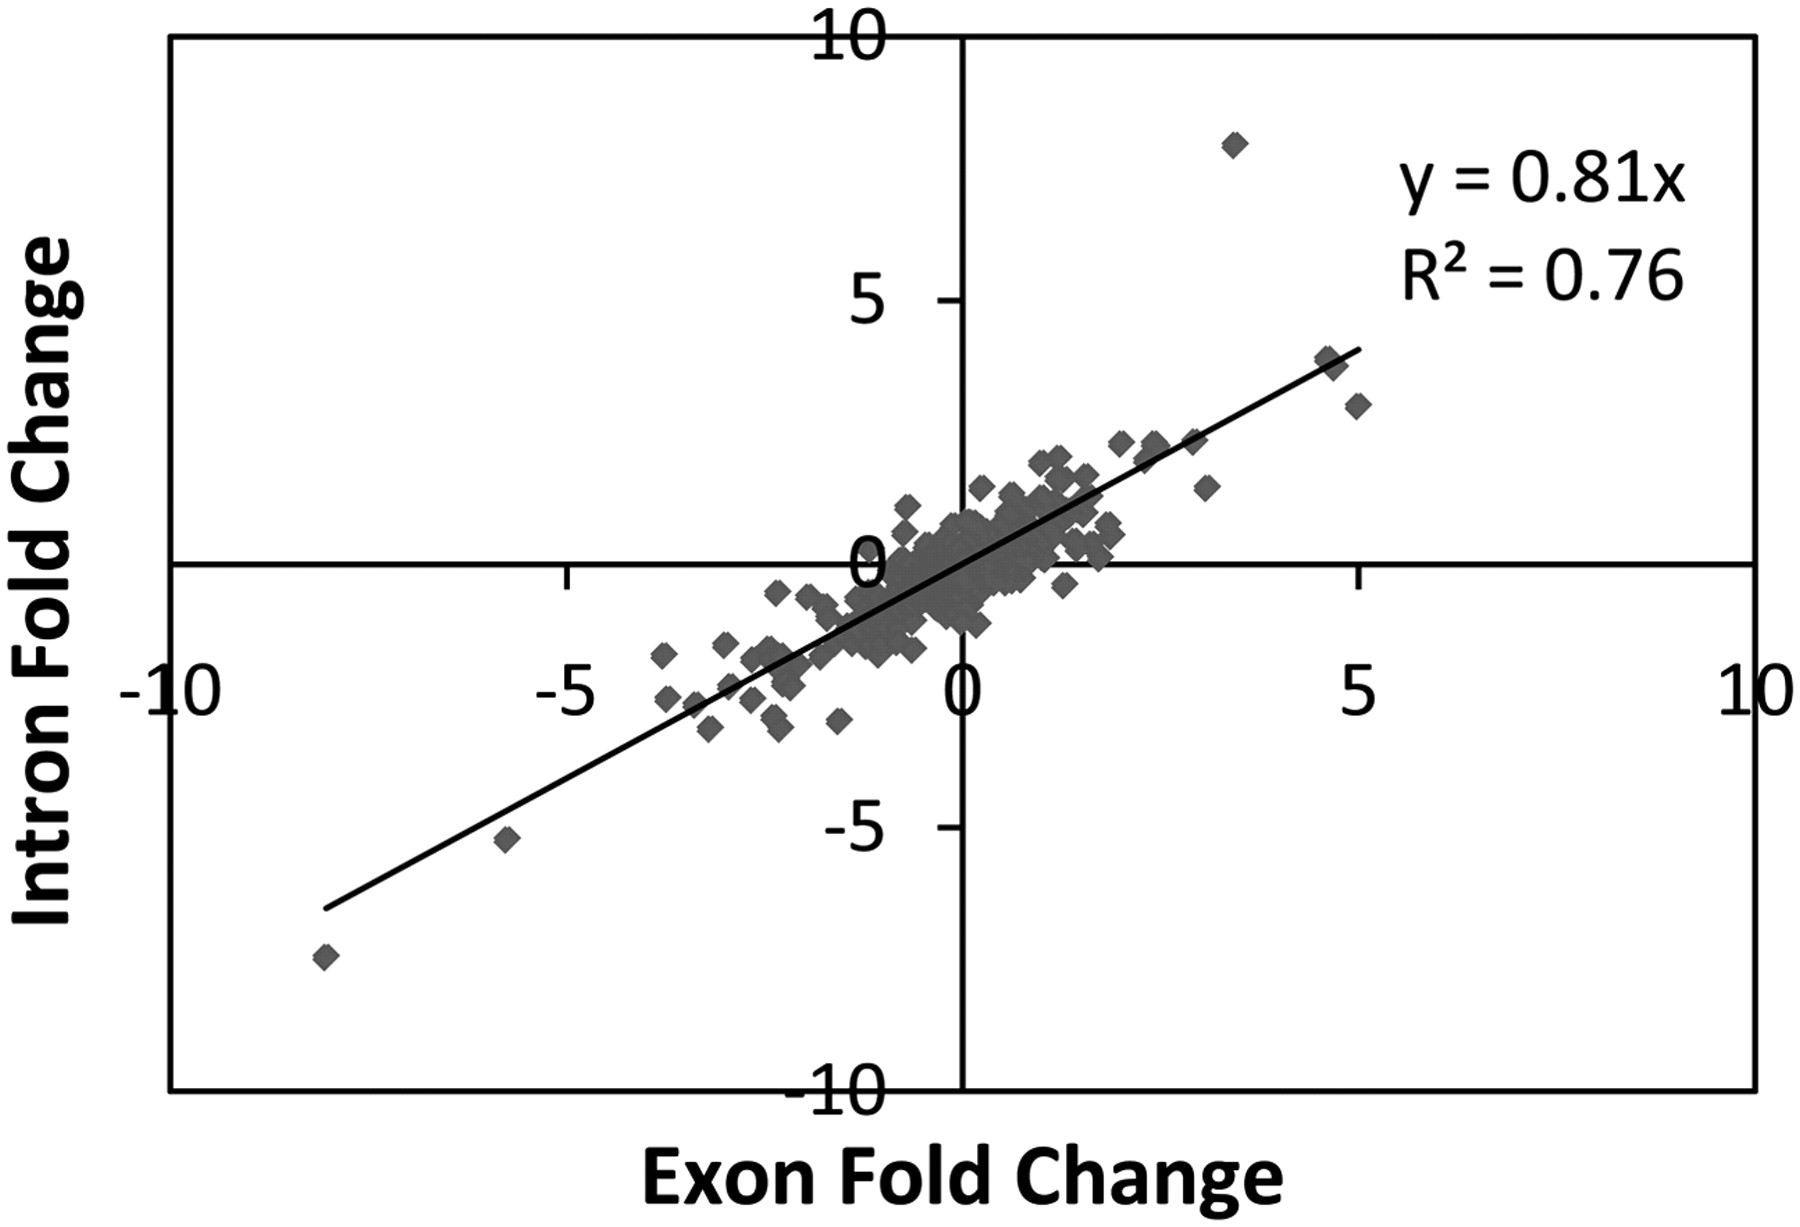
Figure 3.
Correlation between expression levels of exons and introns within the eQTL targets used in the study (see text). This correlation can be used to infer the number of eQTLs acting at the level of transcription versus the number of eQTLs acting co- or post-transcriptionally. The R2-value represents the Pearson correlation, and the y-value represents the slope of the regression line.


