
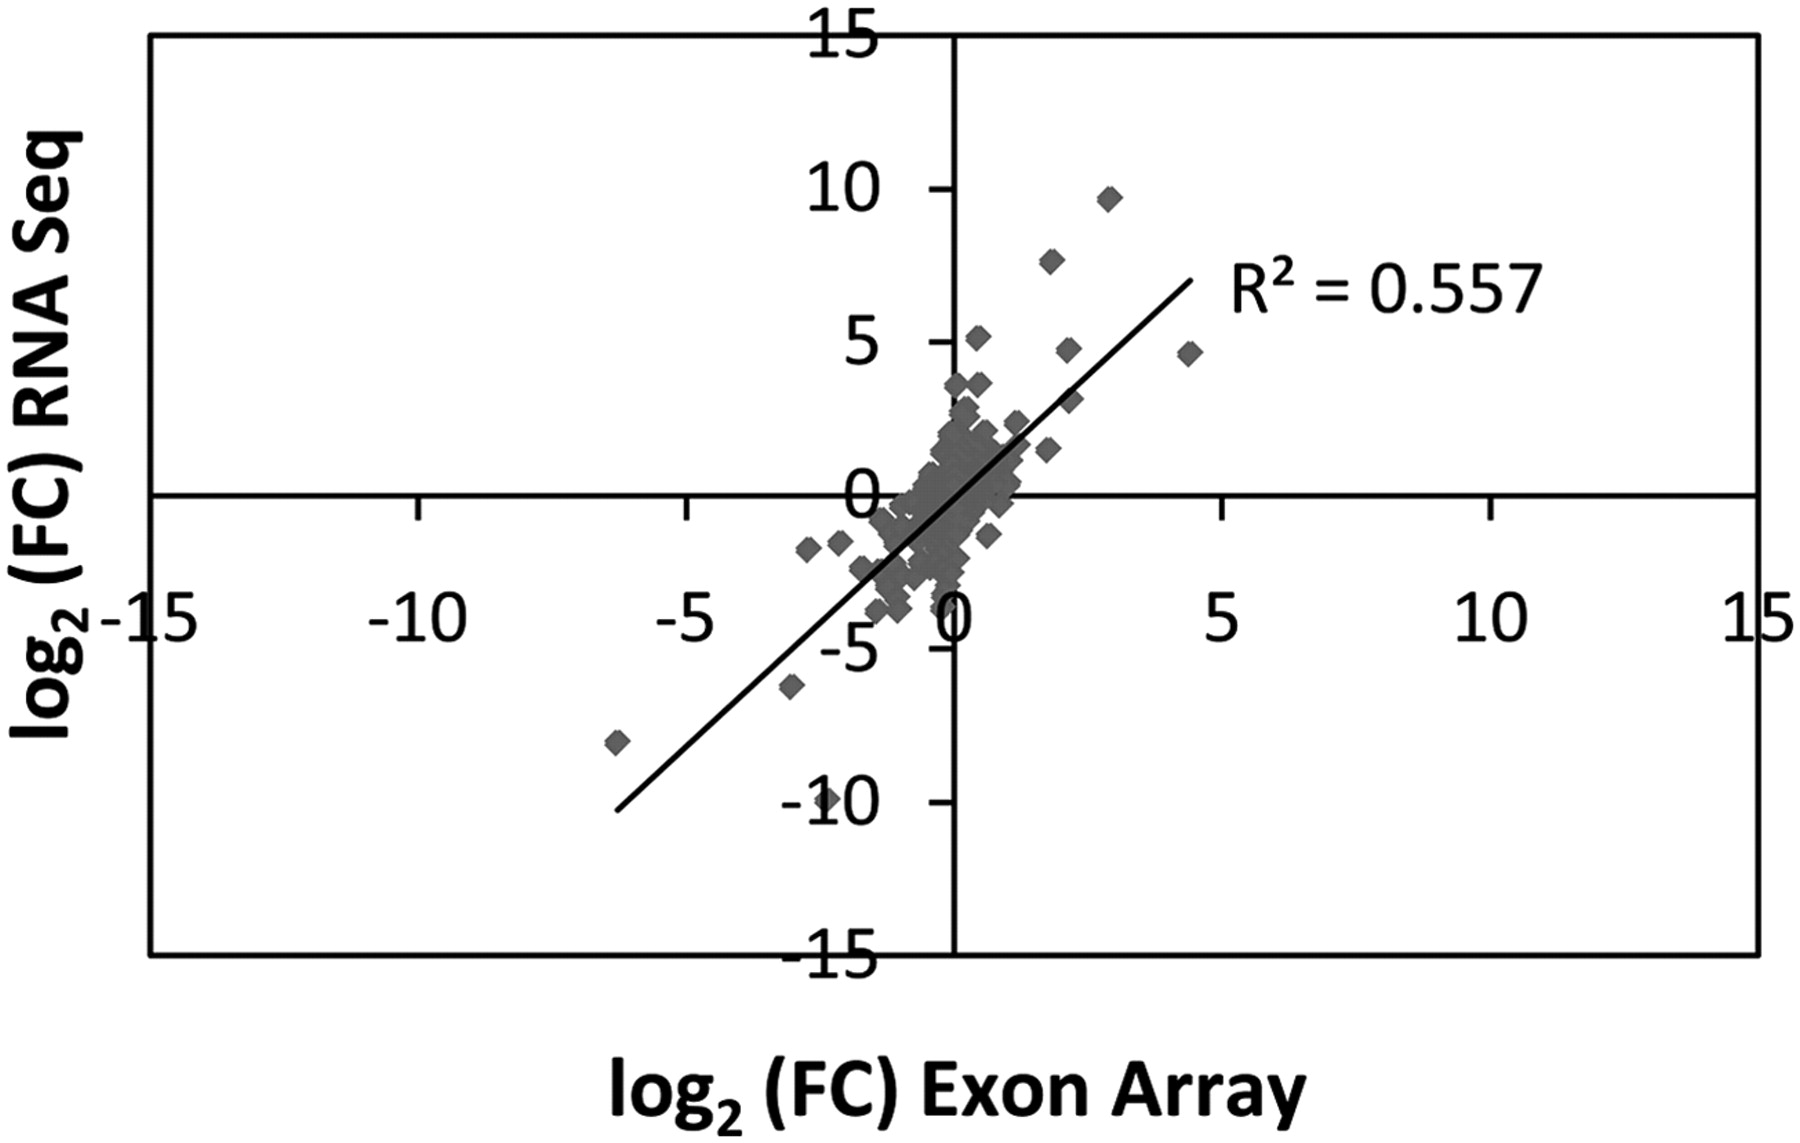
Figure 2.
Correlation between expression level differences of the top 500 eQTL targets predicted by an exon array study (Kwan et al. 2008) and our RNA sequencing study. Gene expression levels from RNA sequencing data were obtained by counting all the short sequencing reads mapping to the mRNA of each gene (exons and exon–exon junctions). Results were normalized and log2-transformed, and the log-ratios (fold changes [FC]) between NA12891 and NA12892 were used to measure the difference in gene expression between the two individuals. The Pearson correlation is shown as the R2 value.


