
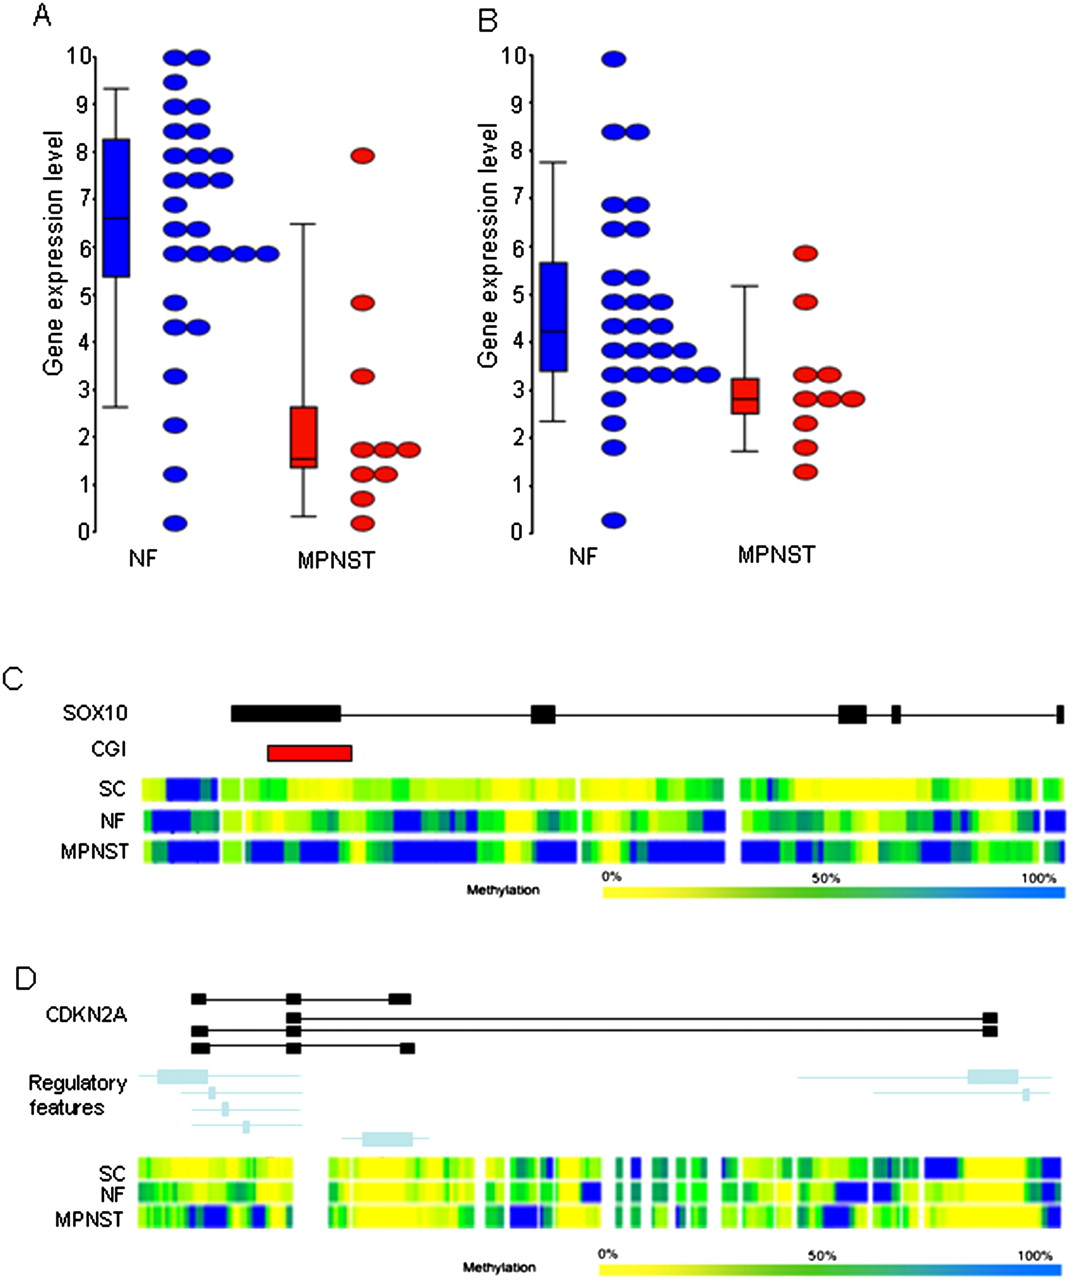
Figure 6.
Example of genes displaying differential gene expression and methylation. (Top) Gene expression in NFs (blue) and MPNSTs (red) for SOX10 (A) and CDKN2A (B). (Bottom) Genomic organization of the gene (black) with genomic regulatory features (blue) and CGIs (red) and the Batman methylation profiles for the three disease states (MPNSTs, NFs, and SCs) for SOX10 (C) and CDKN2A (D), respectively.


