
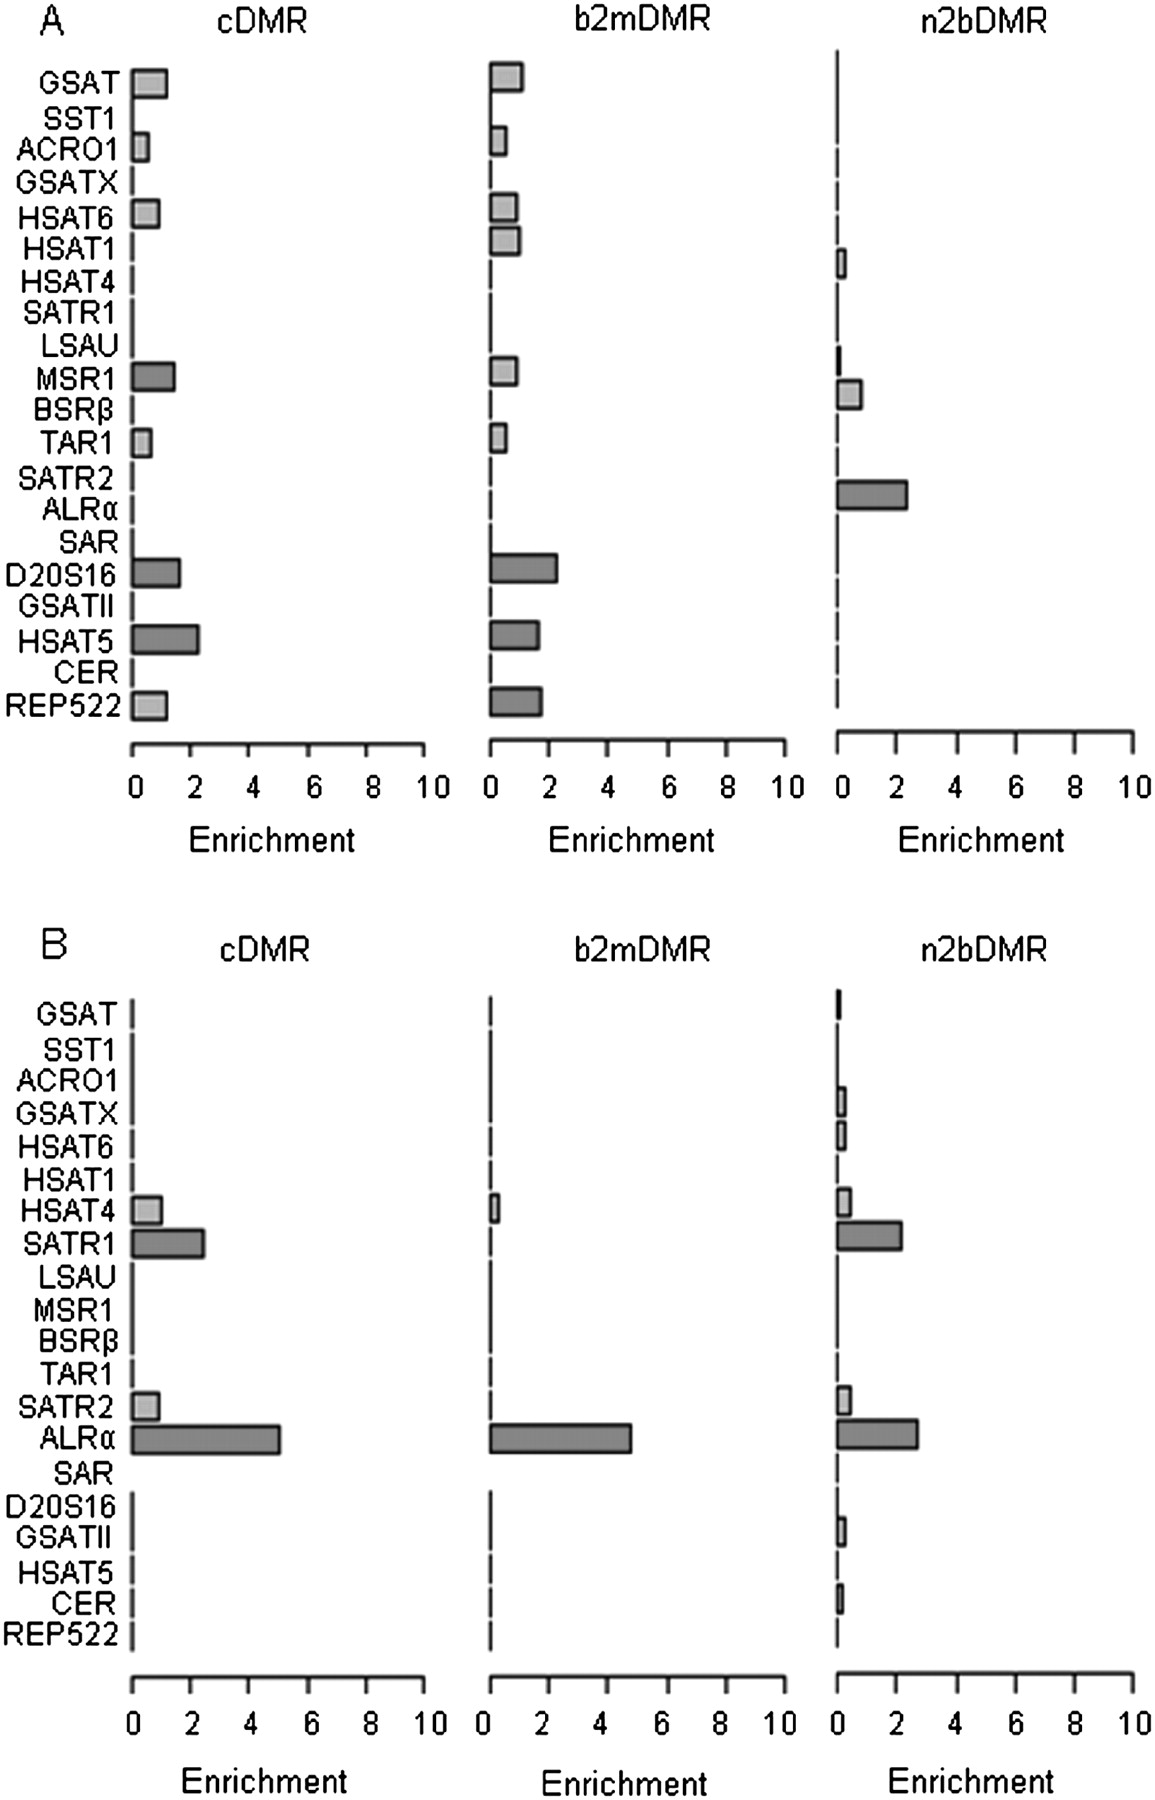
Figure 4.
DMR enrichment of satellite repeat types. Relative enrichment of 19 satellite repeat types for hypermethylated (A) and hypomethylated (B) DMRs. The x-axis shows the level of enrichment; the y-axis, the relevant genomic features. Features highlighted in red show significant enrichment (P < 0.001).


