
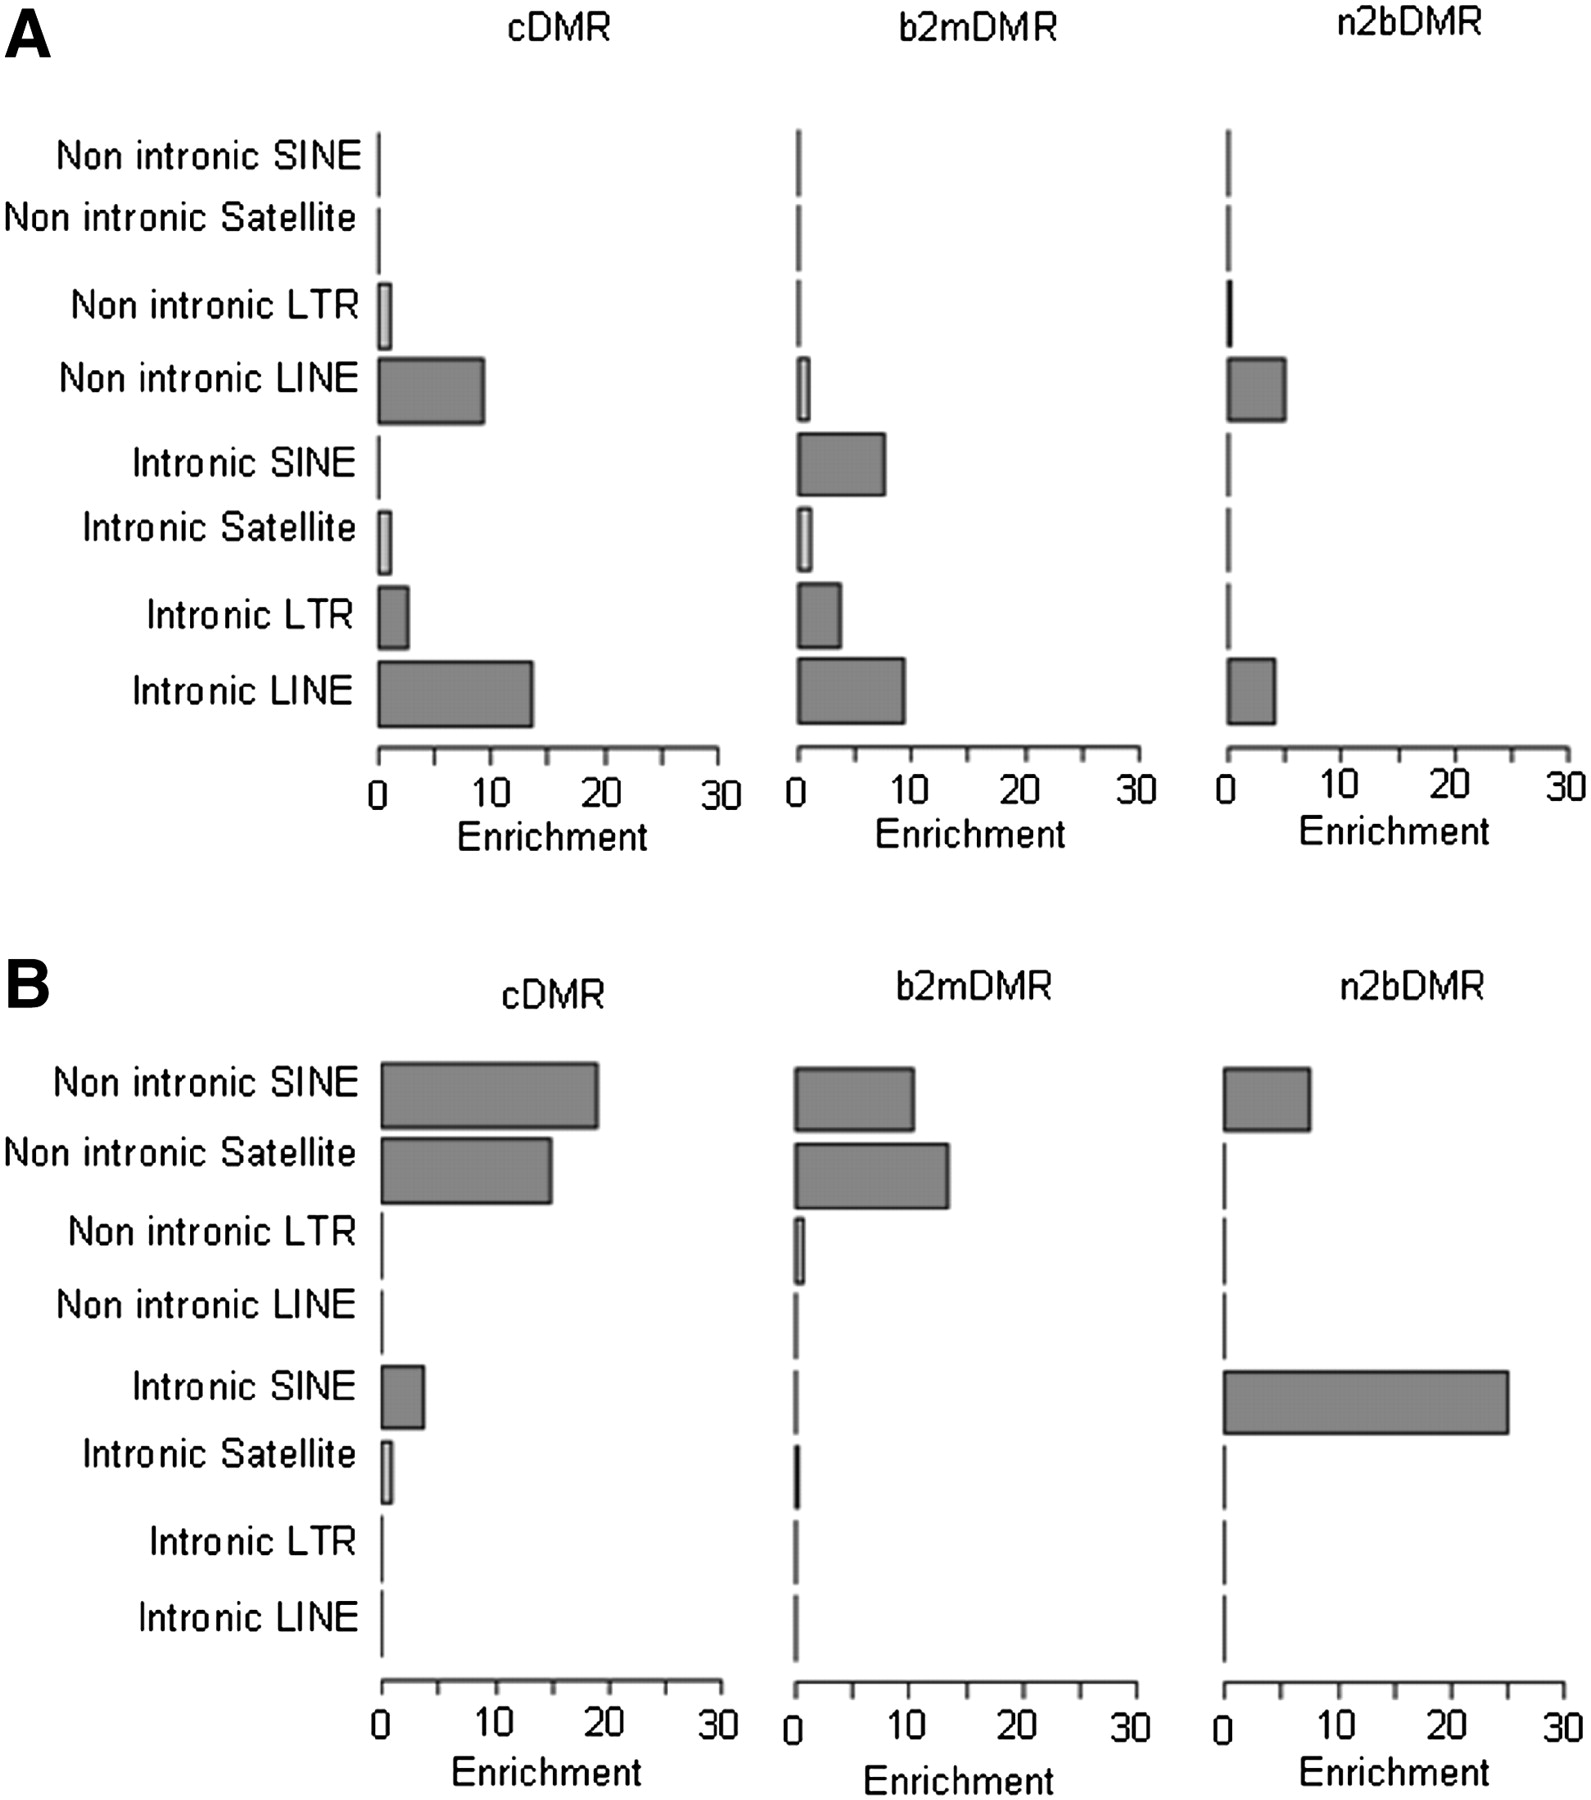
Figure 3.
Relative DMR enrichment of intronic and non-intronic repeats. Shown are the relative enrichment of unique repeats (SINE, satellite, LINE, and LTR) located within introns and outside introns for hypermethylated (A) and hypomethylated (B) DMRs. The x-axis shows the level of relative enrichment; the y-axis, the relevant repeat type. Features highlighted in red show significant enrichment (P < 0.001).


