
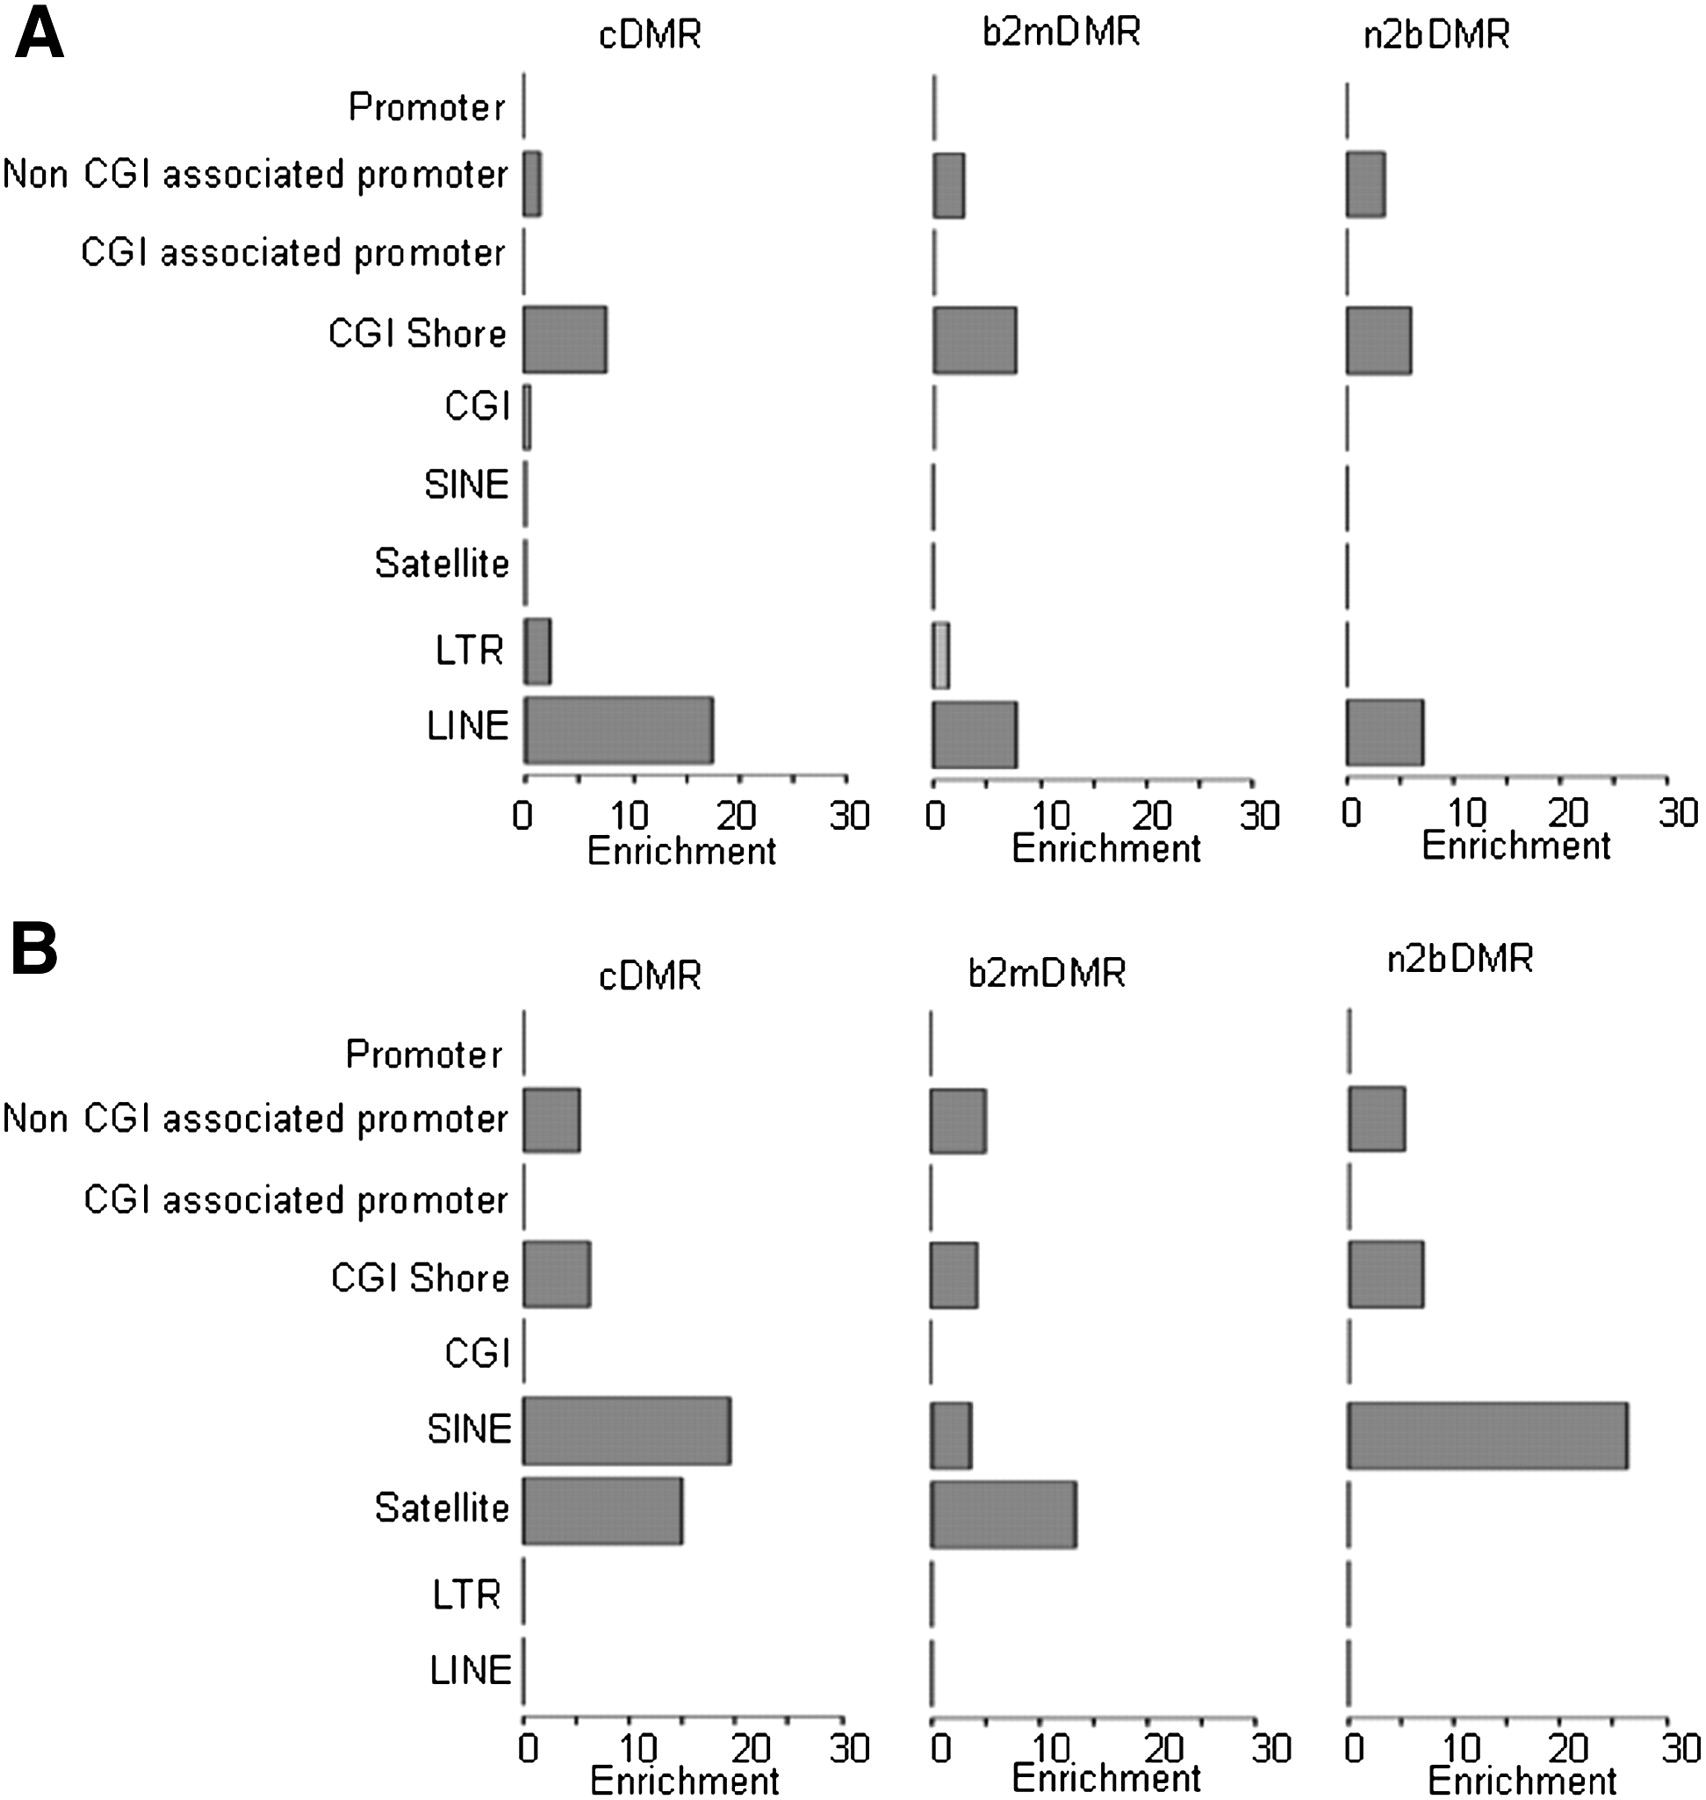
Figure 2.
Relative DMR enrichment. Relative enrichment of DMRs in CGI, CGI shore, promoter, and repeat regions (SINE, satellite, LTR, and LINE), for hypermethylated (A) and hypomethylated (B) DMRs for the three sample comparisons (n2bDMRs, b2mDMRs, and cDMRs). Relative enrichment analysis was carried out on the number of DMRs in each genomic feature compared to the expected number. Features with significant relative enrichment (P < 0.001) are highlight in red. The x-axis shows the relative enrichment score; the y-axis, the relevant genomic features.


