
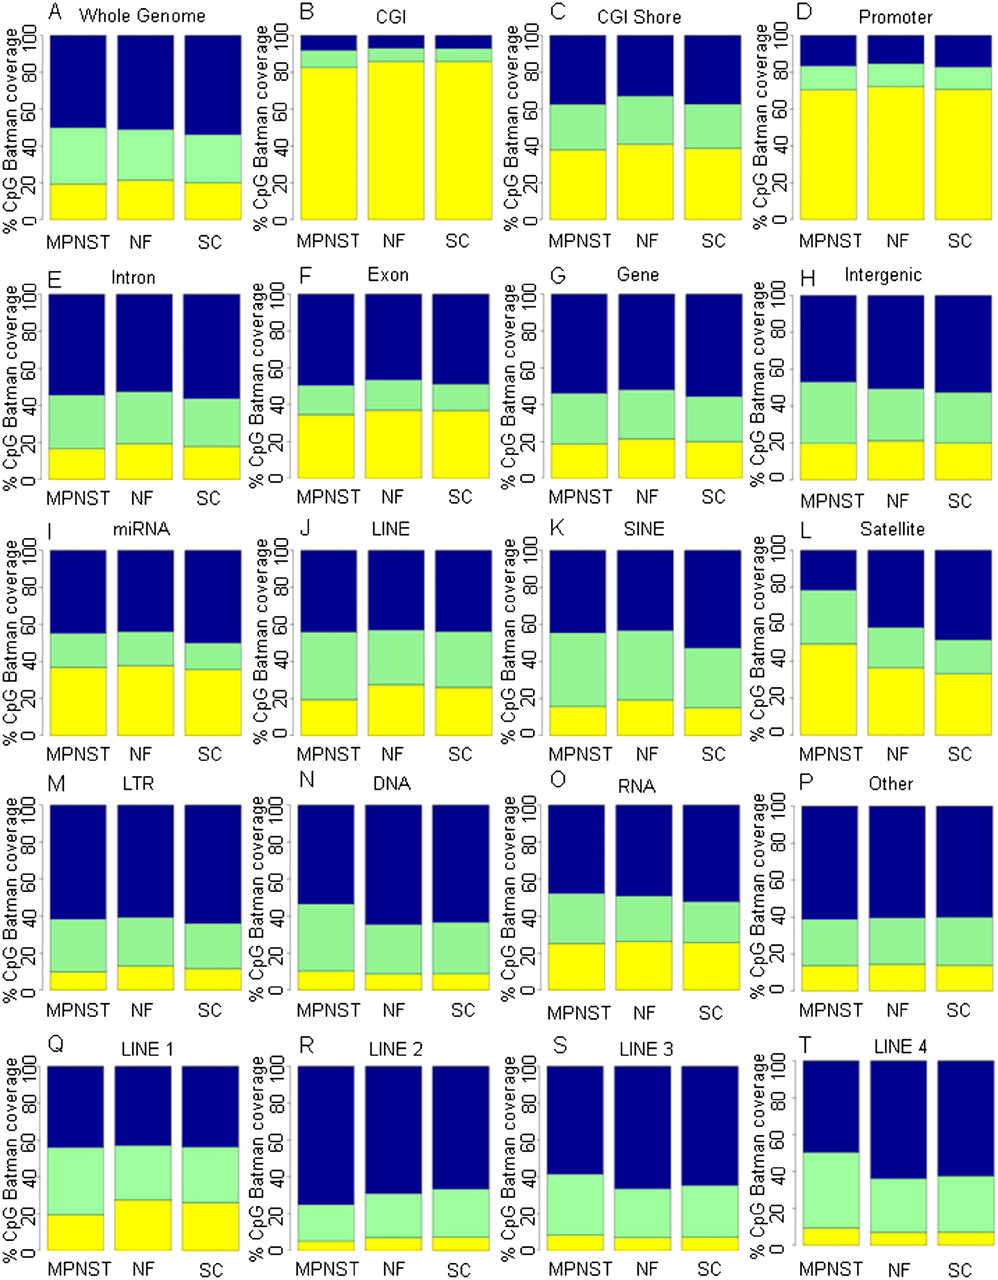
Global DNA methylation profiles. (A–T) Global patterns of methylation in unique genomic features from the Ensembl genome database (Ensembl 52). Shown are the color-coded methylation states of CpGs for the MPNST, NF, and SC samples (x-axis). The mean Batman methylation states of CpGs within a 1-kb window were calculated and categorized into low methylation (yellow, 0%–40%), intermediate methylation (green, 41%–60%), and high methylation (blue, 61%–100%) for each genomic feature. MeDIP-seq/Batman CpG coverage (y-axis) shows the proportion of CpGs covered with Batman methylation scores at low, intermediate, or high methylation levels. Coordinates for genomic features were taken from the Ensembl genome database, with the exception of CGI shores, which were defined as 2 kb on either side of the CGI, and promoters defined as 1 kb upstream of and 0.5 kb downstream from the TSS.


