
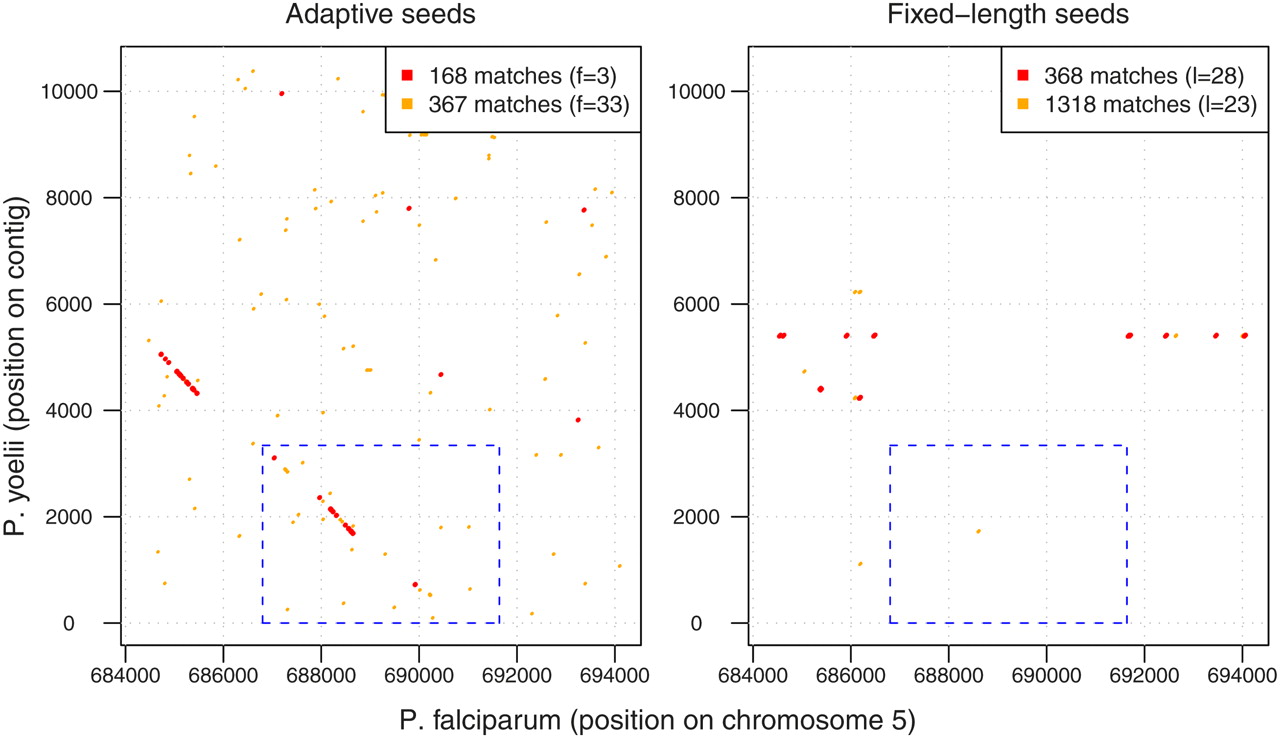
Dot-plots of matches (without extensions) identified by adaptive and fixed-length seeds when comparing the P. yoelii contig with the region of the P. falciparum genome where the MB2 homologous genes are known to exist. Their exact locations are indicated by the dashed boxes in blue. The colored dots in both panels indicate the number of hits in the plot area. As the frequency threshold f for adaptive seeds increases or the length l for fixed-length seeds decreases, the number of hits increases. Caveat: the area each color appears to occupy does not exactly correlate with the number of hits—for each graph, the color with the lower number of hits is drawn over the other color, and also nearby hits cannot be resolved visually at this resolution.


