
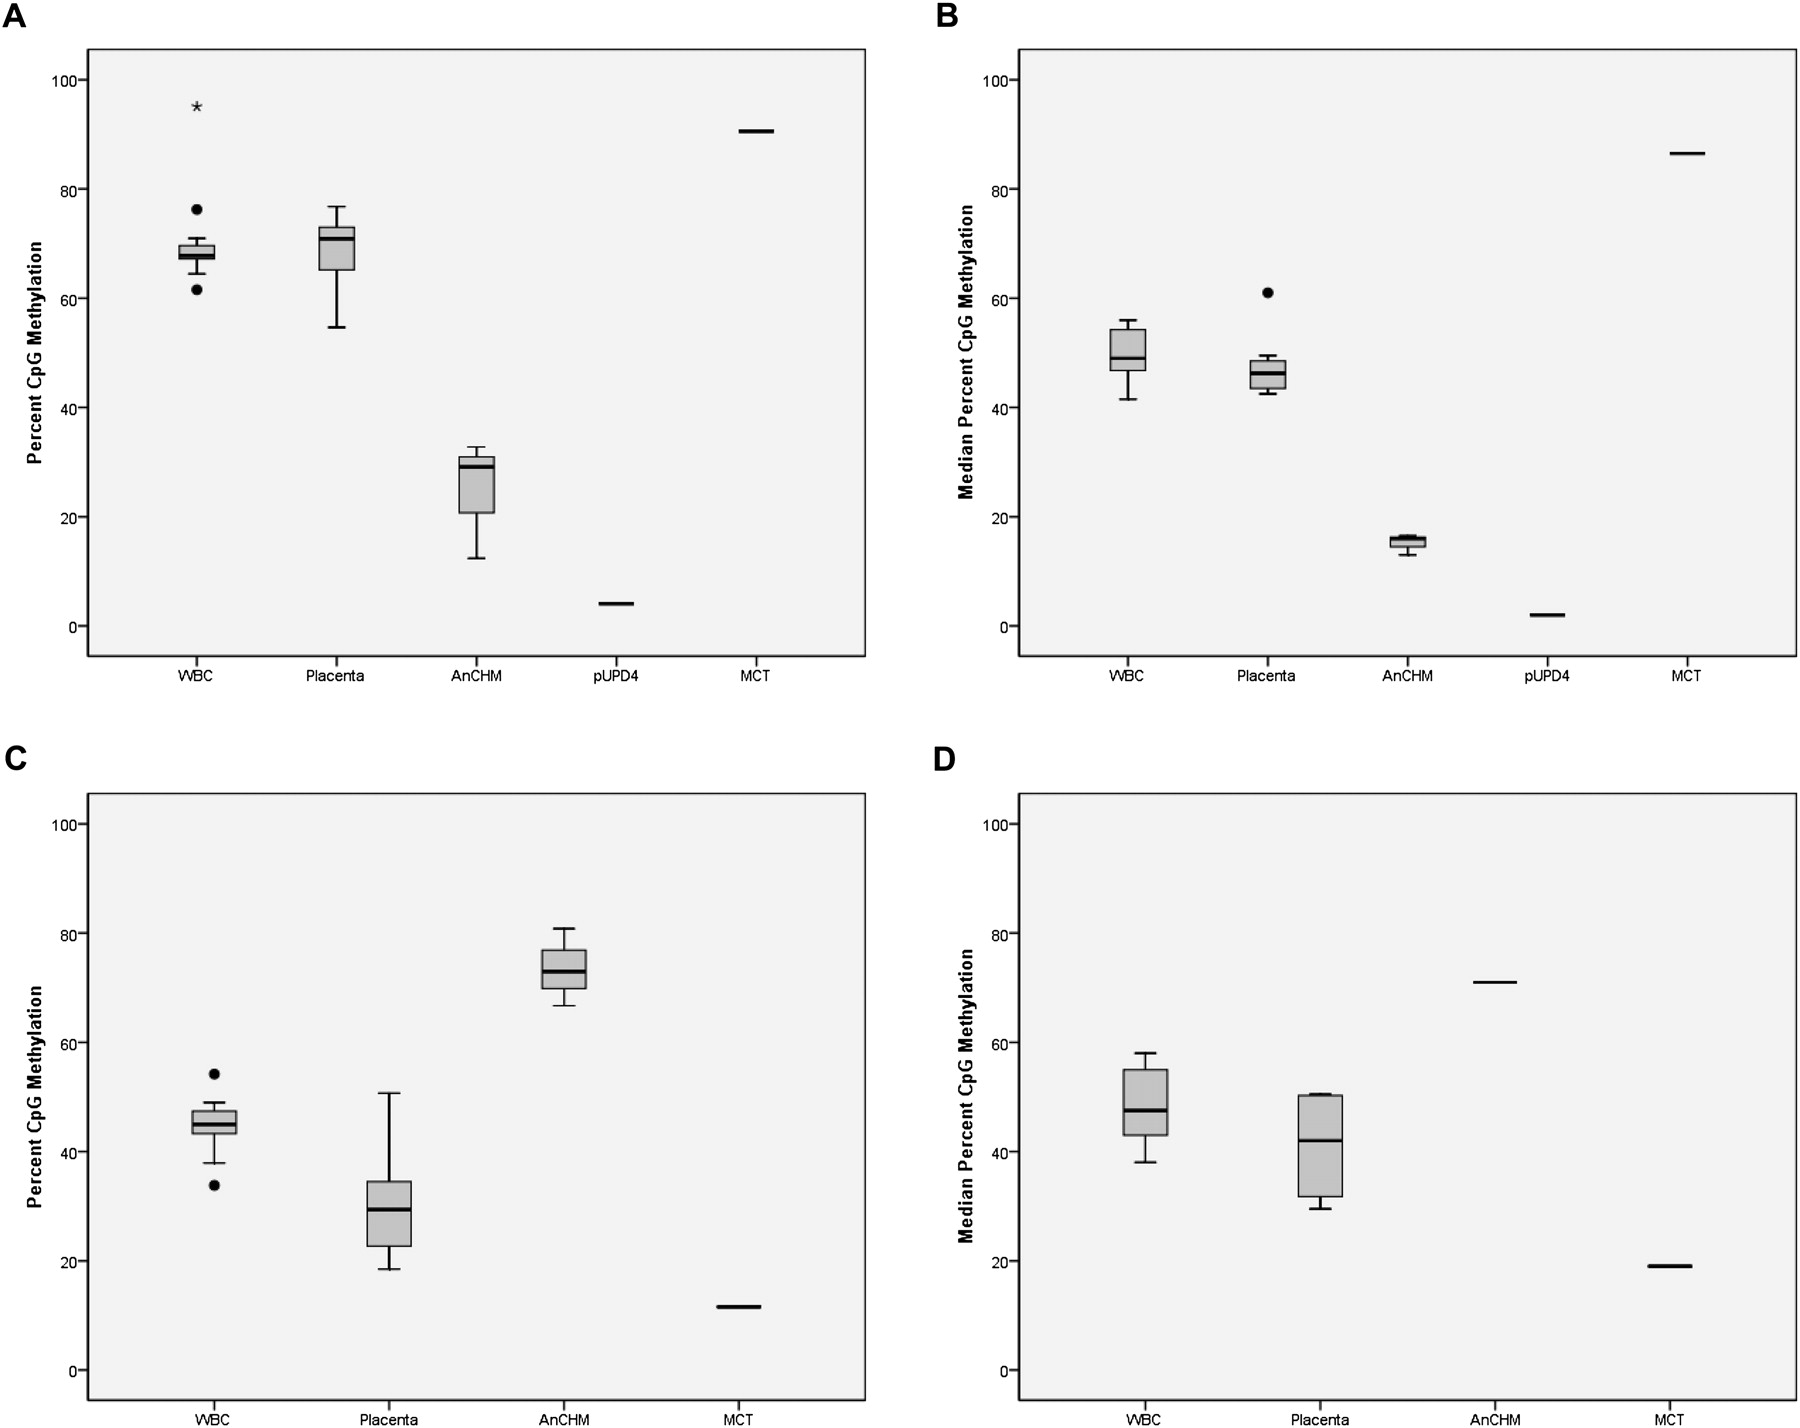
CpG methylation in new candidate differentially methylated regions (DMRs) for the imprinted genes NAP1L5 and ZNF597. (A) Box-and-whisker plot showing the distribution of CpG methylation percent for each tissue at the NAP1L5 CpG site cg01026744 from the Illumina Infinium Human Methylation 27 BeadChip microarray. The methylation data are derived from 16 blood samples, five placenta samples, three AnCHM samples, one paternal UPD4 lymphoblastoid sample, and one MCT sample. (B) Box-and-whisker plot showing the median percent CpG methylation for six consecutive CpG sites at NAP1L5 DMR for each tissue. The bisulfite pyrosequencing data are derived from 15 blood samples, 10 placenta samples, three AnCHM samples, one paternal UPD4 lymphoblast sample, and one MCT sample. (C) Box-and-whisker plot showing the distribution of CpG methylation percent for each tissue at the ZNF597 CpG site cg14654875 from the Illumina Infinium Human Methylation 27 array. The methylation data are derived from 16 blood samples, five placenta samples, three AnCHM samples, and one MCT sample. (D) Box-and-whisker plot showing the median percent CpG methylation for seven consecutive CpG sites within the ZNF597 DMR for each tissue. The bisulfite pyrosequencing data are derived from 14 blood samples, four placenta samples, one AnCHM sample, and one MCT sample.


