
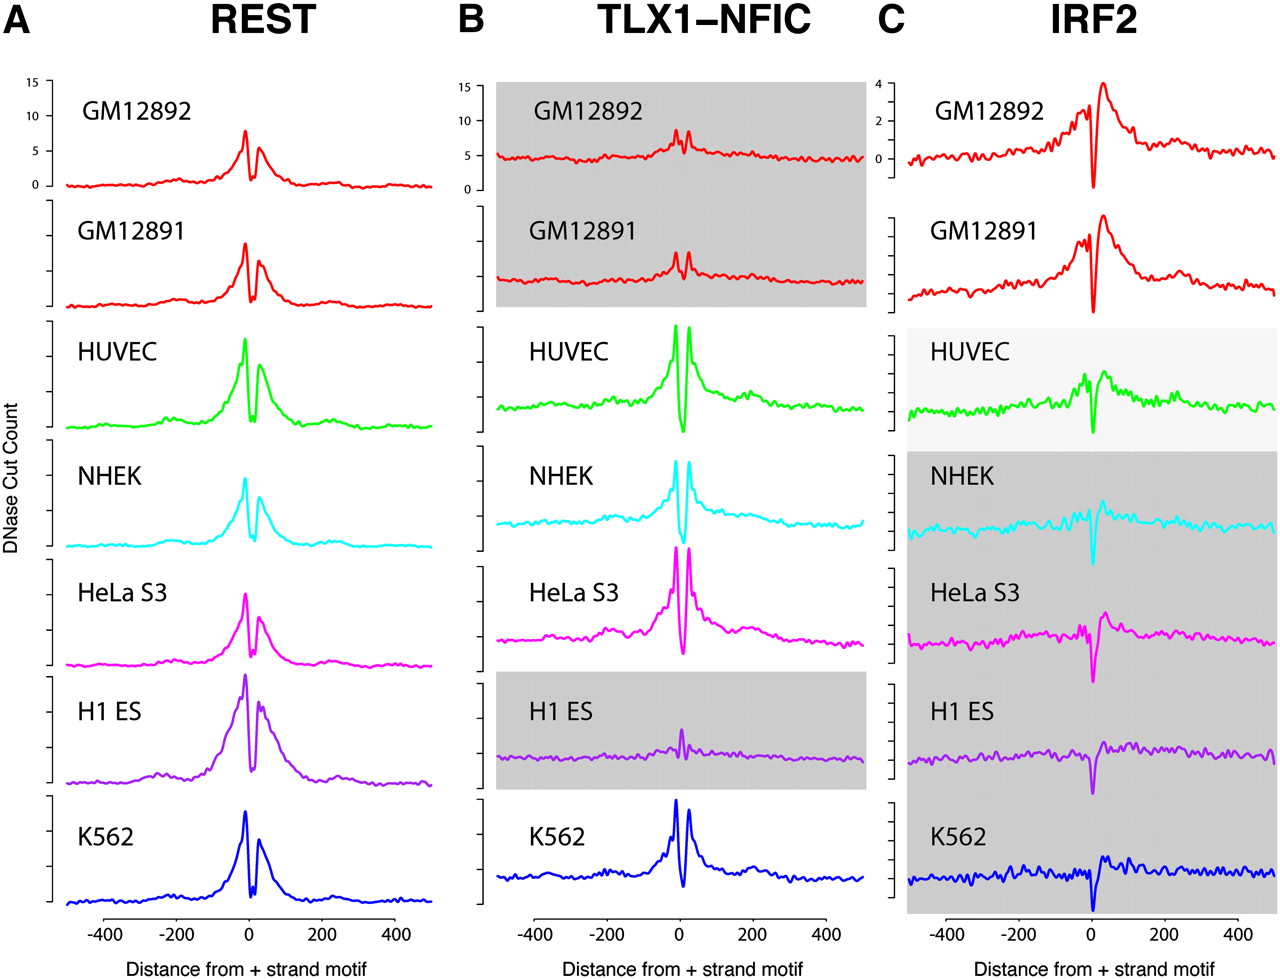
Figure 3.
Identification of cell type–specific footprints. Cumulative DNase-seq footprinting signals were determined across seven different cell lines for REST (A), TLX1-NFIC (B), and IRF2 (C). For each factor, the same set of motifs was used for all seven cell types. DNase-seq read counts were calculated in the regions surrounding these motifs, similar to Figure 1. Regions shaded in gray represent cell types that display reduced footprinting signal. HUVEC IRF2 shows moderate footprinting signal (light gray). Note that for REST, all cell lines display consistent signals.


