
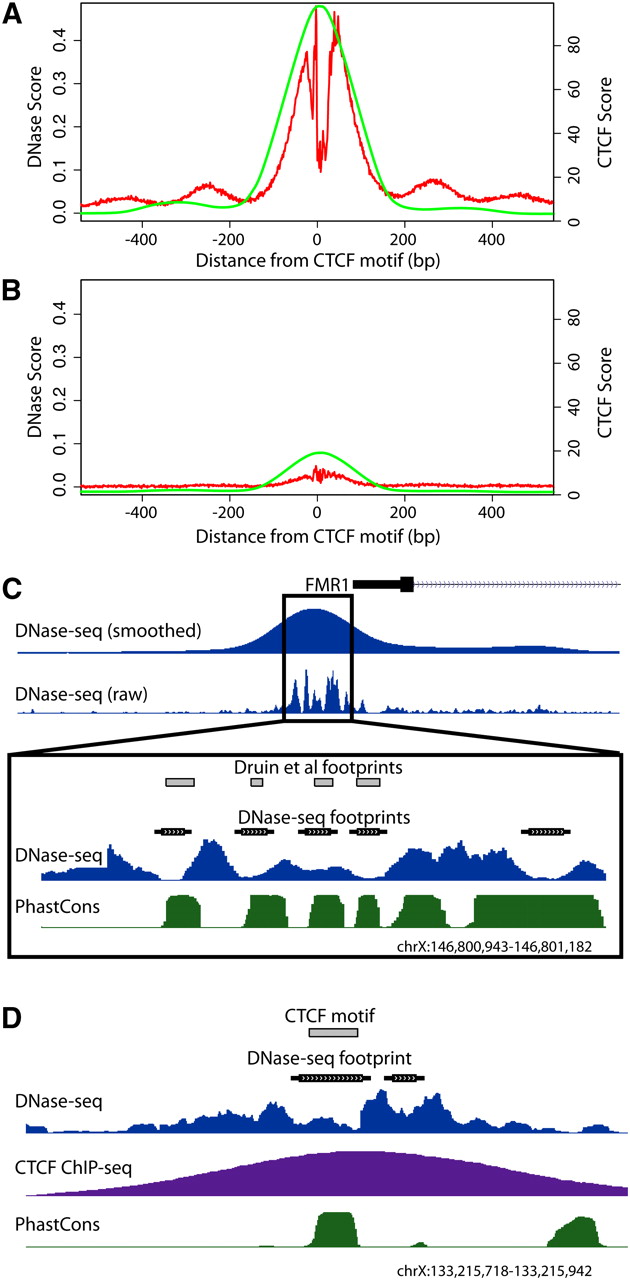
DNase-seq identifies protein–DNA footprints. All potential CTCF binding sites were identified genome-wide using motif matching and compiled such that their 5′ end was set at position zero. Cumulative DNase-seq and CTCF ChIP-seq signals within 500 bp of each site in both directions were determined. (A) CTCF motifs that have a DNase I footprint (red) also display high CTCF ChIP-seq signal (green). (B) CTCF motifs that have no footprint have greatly reduced CTCF ChIP-seq signal. (C) Footprinting using DNase-seq accurately identified footprints within the FMR1 promoter region previously mapped using traditional in vitro DMS footprinting. Dips in raw DNase-seq signal and annotated footprints correspond perfectly with previously identified footprints (gray boxes) (Drouin et al. 1997). The phastCons annotation shows increased levels of evolutionary conservation within called footprints. (D) A representative individual region displaying a DNase I footprint matching a known CTCF binding motif (gray box) with a strong corresponding CTCF ChIP-seq signal. See also Supplemental Figure 1A.


