
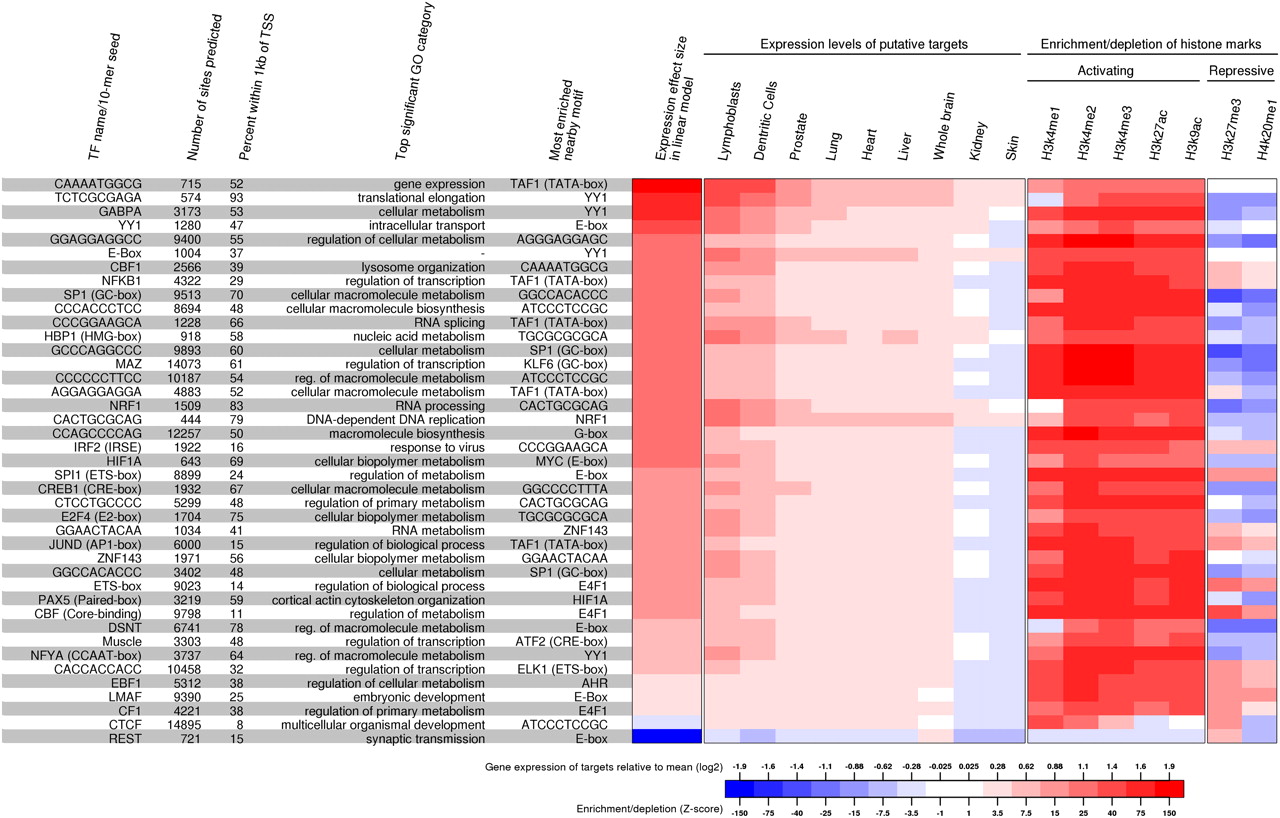
Characteristics of the binding sites for 41 selected motifs. For each motif, we show the total number of inferred active sites (posterior probability > 0.99); the percentage of active sites that are within 1 kb of the nearest TSS; the most enriched GO category of the genes with a TSS within 5 kb of an active site; and the most enriched nonoverlapping element within 100 bp of the motif; the average shift in mean expression for genes containing an active binding site of each element in their promoter region (5 kb from TSS) in the linear model; the difference from average expression of the putative TF targets across nine tissues (Su et al. 2004); a Z-score measuring the enrichment/depletion of seven histone modification marks in the 400-bp region around the bound instances of each motif relative to unbound instances.


