
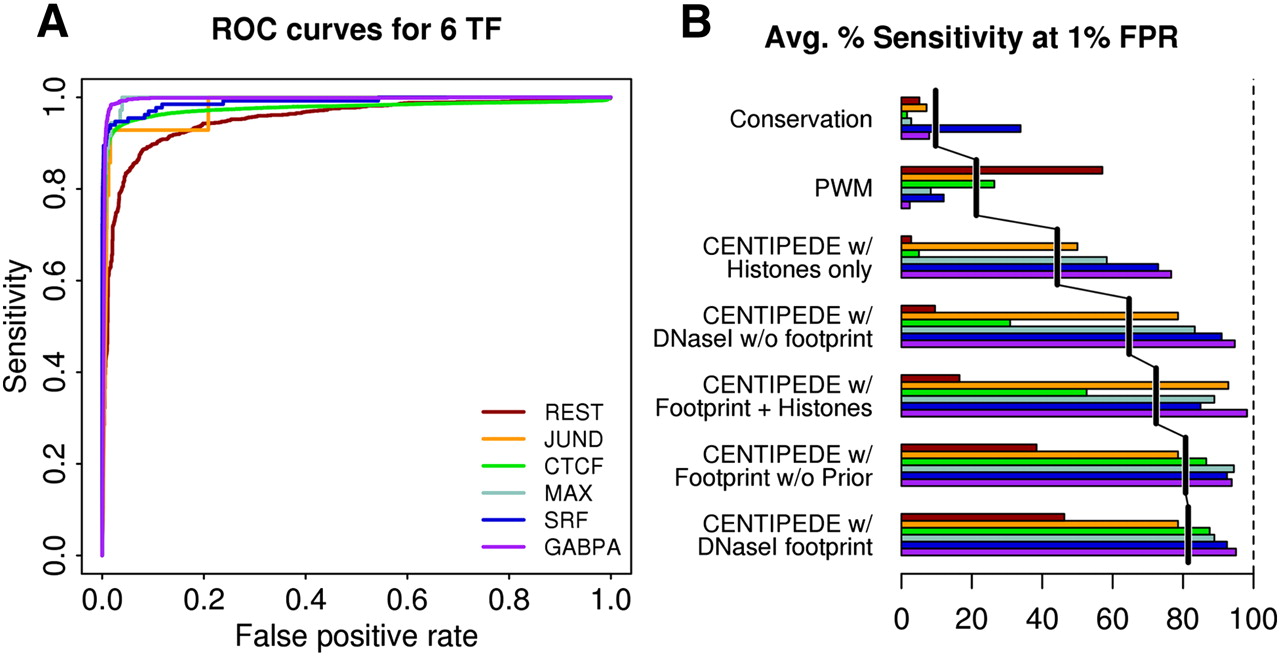
Figure 3.
CENTIPEDE performance for six TFs for which ChIP-seq data are available in LCLs. (A) Individual ROC curves for each TF using the CENTIPEDE model with prior information and full DNase I distribution. (B) Performance across all six TFs in terms of the average sensitivity that can be achieved with a 1% false-positive rate (FPR). For both panels, motif instances are defined as ChIP-seq positives if motifs fall inside a ChIP-seq peak called using MACS, or ChIP-seq negatives if the fraction of reads from the control experiment is less than or equal to that from the ChIP treatment (for details, see Supplemental material).


