
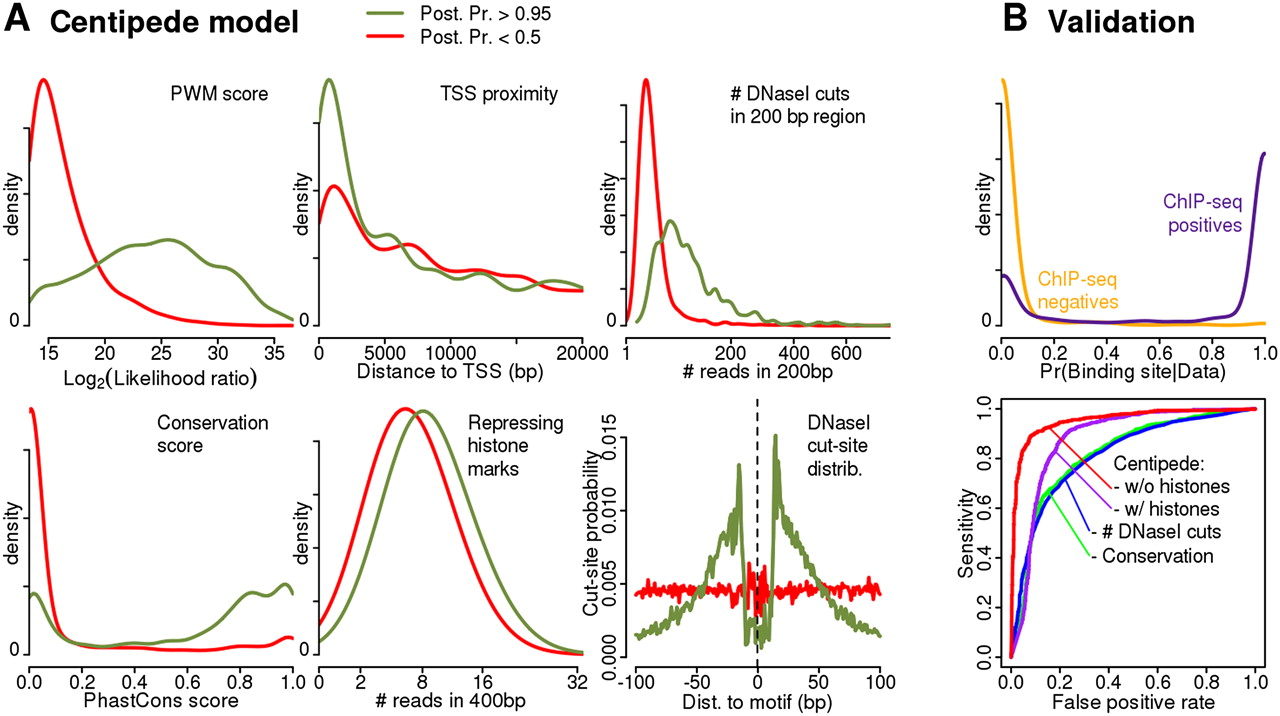
Model learned by the CENTIPEDE approach for the transcription factor REST. (A) Empirical density plots for key aspects of the data for sites inferred by CENTIPEDE to be bound (green lines, CENTIPEDE posterior probabilities >0.95) and unbound (red lines, probabilities < 0.5), respectively. The right-hand column shows comparison to REST ChIP-seq data. (B, upper plot) The distribution of CENTIPEDE posterior probabilities for ChIP-seq positives (motif inside a ChIP-seq peak, as reported by ENCODE using MACS) (Zhang et al. 2008) and for ChIP-seq negatives (fraction of reads from the control experiment is lower or equal compared to that from the ChIP experiment). (Lower plot) ROC curves for four methods of ranking binding sites. In decreasing order of performance, these are CENTIPEDE with DNase I data; CENTIPEDE with DNase I data and histone marks; number of DNase I reads within 200 bp; phastCons conservation score.


