
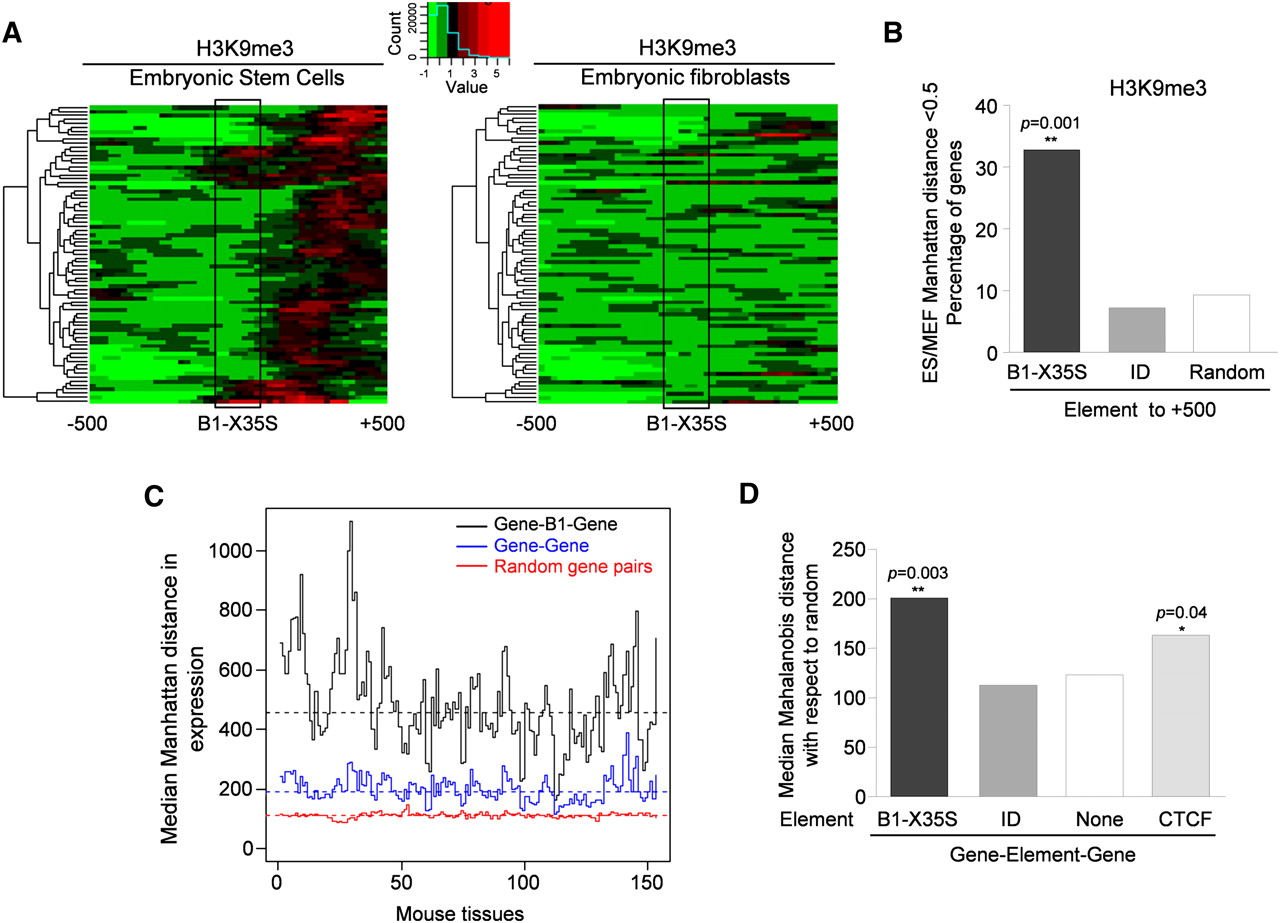
Distinct patterns of heterochromatin and gene expression upstream and downstream from B1-X35S. (A) H3K9me3 analyzed in mouse ES cells and MEFs at 75 B1-X35S loci between −500 bp (upstream) and +500 bp (downstream) from the SINE (box). ChIP-seq data were taken from NCBI GEO repository (GSE12241) (Mikkelsen et al. 2007). Red indicates higher and green lower H3K9me3 levels. (B) H3K9me3 levels downstream of B1-X35S and SINE ID elements (element to +500) in 700 instances common to ES and MEF cells were analyzed. Data are presented as the ES/MEF Manhattan distance ratio. A larger distance indicates higher H3K9me3 content in ES cells. Random sequences were also analyzed as negative controls. (C) The effect of B1-X35S on the differential expression of flanking genes was analyzed in the following groups (700 gene pairs for each): gene pairs having a B1-X35S between them (gene-B1-gene); gene pairs lacking B1-X35S (gene-gene); randomly located gene pairs (random). The difference in expression for each pair in every group was analyzed in 150 tissues of the mouse gene expression atlas and the values obtained represented as the median Manhattan distance in expression. Higher values represent larger differences between adjacent genes. The mean distance for each condition is indicated by a horizontal dashed line. (D) The gene–B1X35S-gene, gene–ID-gene, and gene–gene groups were analyzed using the Mahalanobis algorithm. The impact of the binding sequence for CTCF on the expression of contiguous genes (gene–CTCF-gene) was also determined using ChIP-seq data from the NCBI GEO repository (GSE11431) (Chen et al. 2008).


