
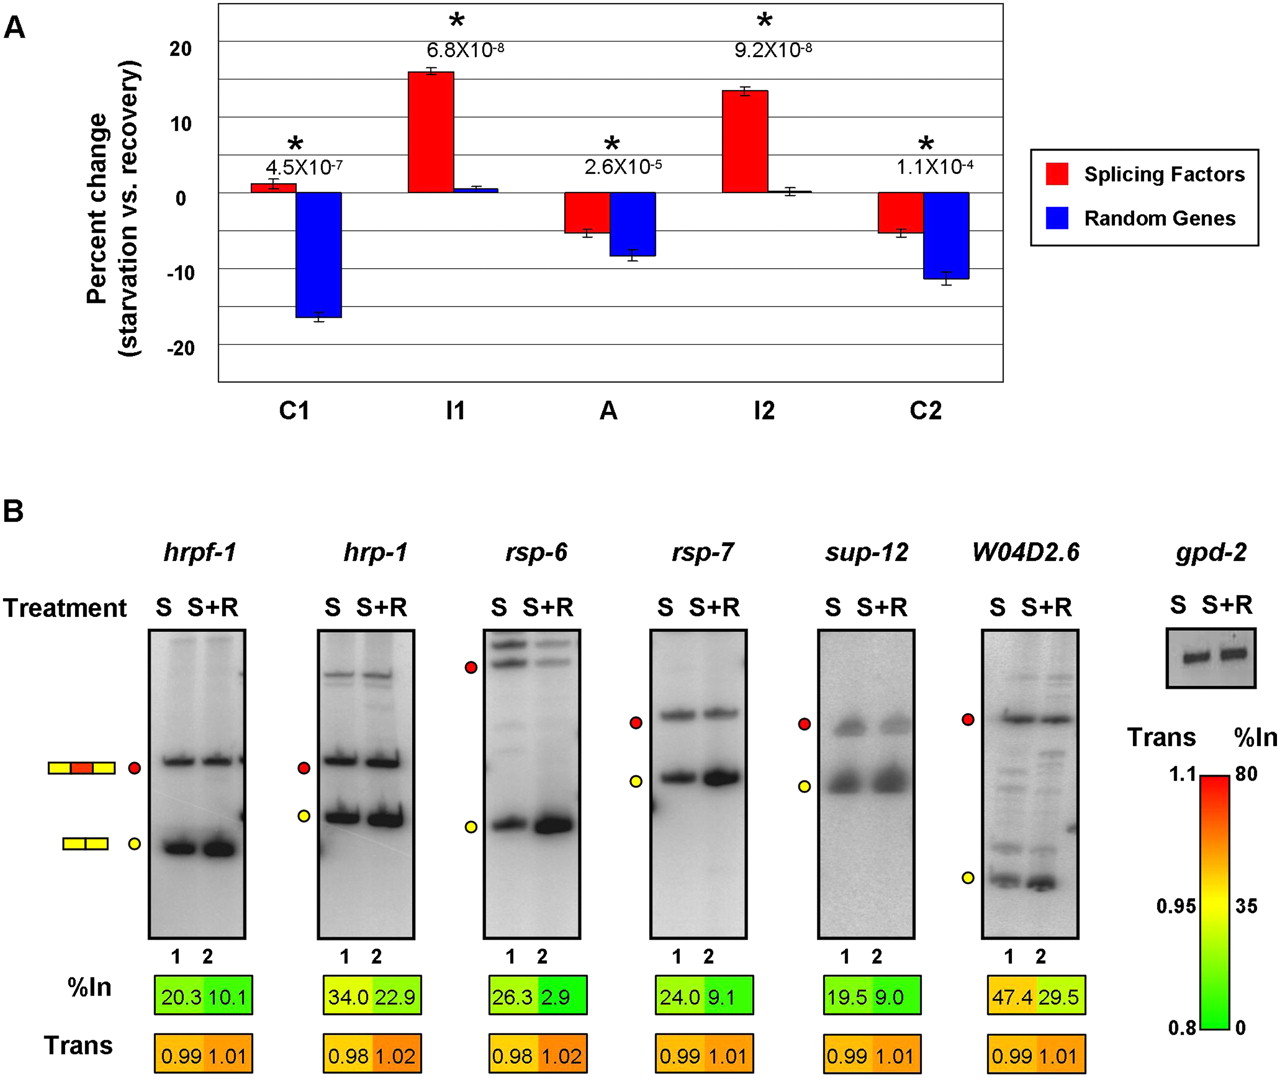
Transcription elongation-dependent regulation of splicing factor genes during starvation of C. elegans. (A) Analysis of the changes in average Pol II distribution (as measured by ChIP-seq) in C. elegans under starvation and growth recovery conditions, for C1–I1–A–I2–C2 regions from a set of splicing factor genes, and C1–I1–A–I2–C2 regions from an equivalent number of randomly selected genes that have comparable expression levels. Bar graphs show the percent change of Pol II signal within each individual region under starvation versus recovery conditions. Analyzed data are from Baugh et al. (2009); see Methods for details. Asterisks highlight statistically significant changes in Pol II occupancy between starvation and recovery conditions (P-values ≤ 1.1 × 10⁻⁴, Wilcoxon signed-rank test). (B) RT-PCR analysis of AS events in splicing factor genes corresponding to those displaying increased Pol II occupancy in flanking intron regions upon starvation conditions (A). RT-PCR assays were performed as described in Figure 2 on total RNA isolated from worms subjected to starvation and recovery conditions. RNA levels were normalized to gdp-2 mRNA. S, starved worms; S+R, starved worms reintroduced to food. Numerical values below each panel represent average measurements from three independent experiments. Additional RT-PCR experiments and numerical quantification of the data are shown in Supplemental Figure S12.


