
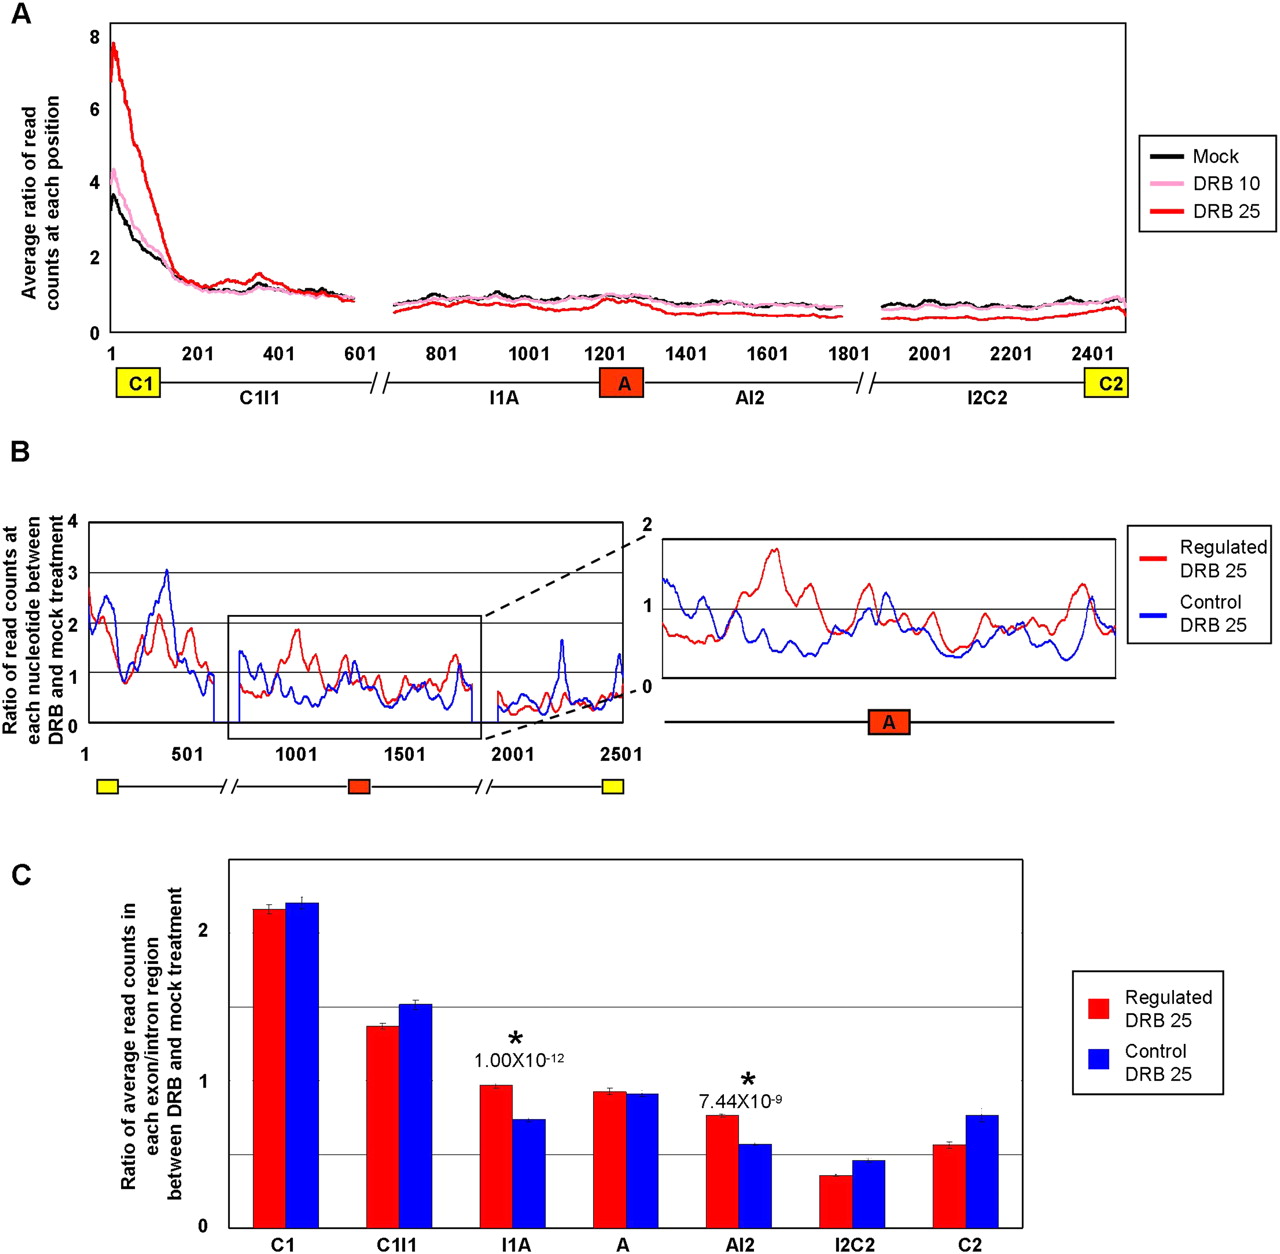
Increased Pol II occupancy over intron sequences flanking alternative exons that display Pol II elongation rate-dependent regulation of AS. Jurkat cells were treated with or without DRB as described in Figure 1, cross-linked with formaldehyde, and Pol II cross-linked to sheared chromatin fragments was immunoprecipitated with a monoclonal antibody (4H8) specific for the Pol II CTD. Illumina short (44 nt) sequence reads were generated from the immunoprecipitated chromatin fragments and these were mapped to the exons and flanking 500 nt intron sequences, corresponding to the C1–A–C2 regions analyzed by microarray profiling in Figure 1. C1, first/upstream constitutive exon; C2, second/downstream constitutive exon; A, alternative exon; I1, first/upstream intron; I2, second/downstream intron. (A) Plots showing merged distributions of Pol II over the profiled exons and intron sequences of all microarray profiled genes. The Pol II distributions are shown as averages of ratios of read counts at each position over a value representing the total number of reads mapped to all exons and introns in the gene set over the total length of the exons and introns in that set. Lengths of exons were normalized by binning into 100 equal-size segments to facilitate direct comparison. Plots are shown for mock (control) treatment and treatments with 10 and 25 μg/mL DRB. (B) Pol II occupancy for microarray-profiled genes with DRB (25 μg/mL)-dependent increases in exon inclusion and decreases in mRNA levels, designated as “Regulated” genes (red trace). A similar number of genes with comparable mRNA levels but that do not detectably respond to DRB (25 μg/mL) are shown for comparison, designated as “Control” genes (blue trace). Additional control traces are shown in Supplemental Figure S11. The traces show the average ratios of read counts at each position over a sliding window of 20 nt in the DRB-treated versus mock-treated samples (see Methods for details). (C) Bar graph quantifying average ratios of Pol II occupancy within each indicated region, as determined from the data in panel B. Regions displaying significant increases in Pol II occupancy in the DRB-treated relative to mock treated samples, between the Regulated and Control sets of genes, are indicated. Error bars indicate standard error and P-values were calculated using Wilcoxon signed-rank test.


