
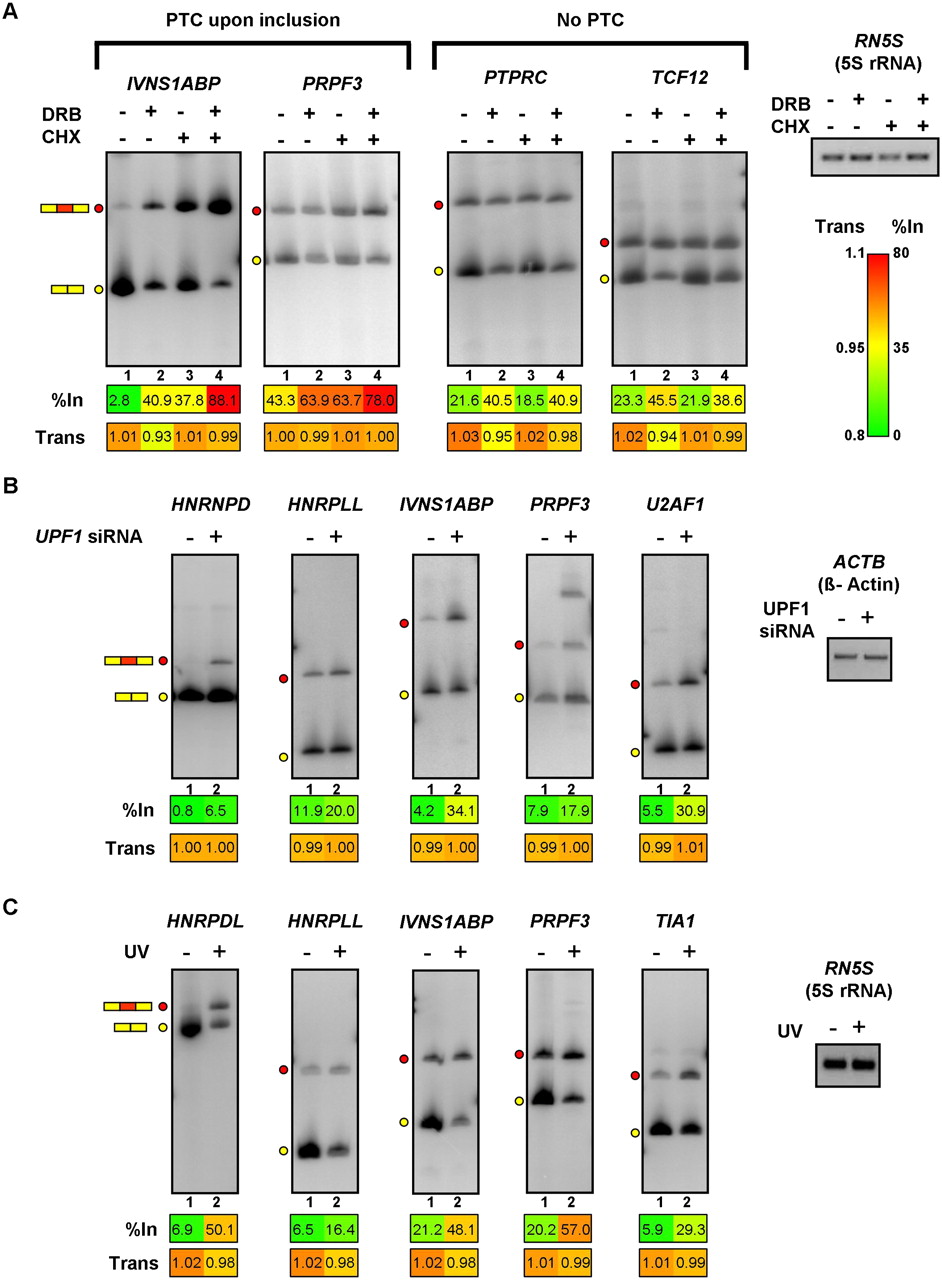
Roles for NMD and cell stress in the control of splice variant levels regulated by Pol II elongation rate. (A) Cycloheximide (CHX) treatment of PMA-stimulated Jurkat cells promotes increased levels of PTC-containing splice variants that also respond to DRB and camptothecin treatments. Jurkat cells were treated with DRB for 24 h, followed by PMA stimulation. Cycloheximide was added an hour after the addition of PMA, and RNA was isolated 5 h later. RT-PCR analysis of the RNA samples was performed as described in Figure 2. Numerical values below each panel represent average measurements from three independent experiments. Additional RT-PCR experiments and numerical quantification of the data are shown in Supplemental Figure S8. (B) Knockdown of the essential NMD factor UPF1 in HeLa cells results in specific increases in exon-included, PTC-containing splice variants that are responsive to treatments that inhibit Pol II. UPF1 was knocked down in HeLa cells by transfection of a specific siRNA (Kim et al. 2005) for 48 h, prior to harvesting total RNA for analysis by RT-PCR assays, which were performed as described in Figure 2. Numerical values below each panel represent average measurements from three independent experiments. Additional RT-PCR experiments and numerical quantification of the data are shown in Supplemental Figure S9. (C) UV irradiation of Jurkat cells results in increased levels of exon inclusion and decreased levels of mRNA for RNA processing factor genes that respond to Pol II elongation perturbation. Jurkat cells were exposed to 120 J/m2 UV and allowed to recover for 6 h prior to harvesting total RNA for RT-PCR assays, which were performed as described in Figure 2. Numerical values below each panel represent average measurements from three independent experiments. Additional RT-PCR experiments and numerical quantification of the data are shown in Supplemental Figure S10. Loading/recovery controls in A–C are as shown in Figures 2 and 3.


