
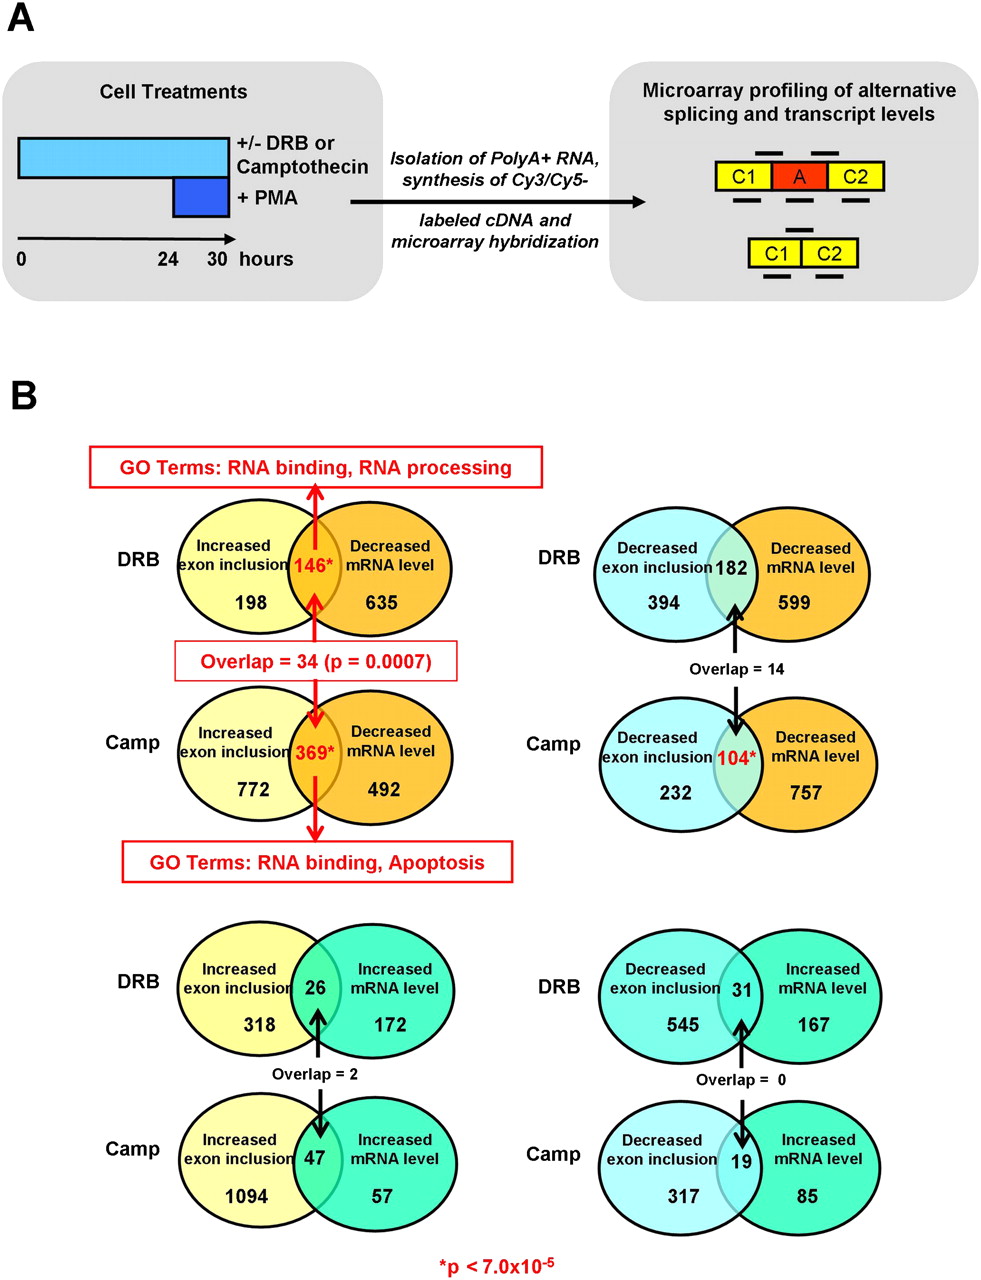
Global profiling of AS and mRNA levels affected by DRB and camptothecin inhibition of RNA polymerase II elongation. (A) Overview of the experimental and data analysis strategy. Jurkat T cells were mock-treated (with DMSO) or treated with three different concentrations of DRB (10, 25, and 50 μg/mL in DMSO) or camptothecin (4, 8, and 16 ng/mL in DMSO) for 24 h, and then stimulated with PMA for 6 h. Cy3- and Cy5-labeled cDNA prepared from poly(A)+ RNA isolated from the treated cells was hybridized to a custom microarray containing sets of exon and junction-specific probes (bold lines) representing 5782 human cassette-type AS events that are conserved in mouse transcripts. A, alternative exon; C1 and C2, 5′ and 3′ flanking constitutive exons. (B) Analysis of the microarray data reveals genes with changes in AS and mRNA levels. The Venn diagrams indicate the numbers of genes that change in each direction (color-coded according to increased/decreased mRNA level and increased/decreased splicing level) upon DRB and camptothecin (Camp) treatments. Numbers of genes with significantly overlapping changes at the mRNA and splicing levels are indicated in red (P-value < 7.0 × 10⁻⁵). Only genes with coincident increased exon inclusion and decreased mRNA levels are significantly enriched in Gene Ontology (GO) categories (red text; FDR < 0.005).


